
Decarbonising portfolios: Are institutional investors delivering on their climate objectives?
- 20 September 2022 (5 min read)
- Many asset owners are setting portfolio-level net zero emissions targets with the aim of contributing to the goals of the Paris Agreement
- As investors move from goal setting to measuring success, attention has turned to the factors that are driving portfolio decarbonisation
- There are four key factors that will impact portfolio carbon emissions, only one of which – reducing absolute emissions – will help to deliver net zero
We have seen an explosion of interest in climate-aware and Paris Agreement-aligned portfolios over the last few years. Investors have set objectives ranging from mitigating climate risks and reducing fossil fuel exposures all the way to targeting net zero by 2050. While there are several ways to aim for the goals of the Paris Agreement,1 this paper proposes an innovative approach for how asset owners can definitively measure the different drivers of changes in portfolio carbon emissions and assess whether those drivers are consistent with their own net zero goals.
We think this approach is suitable for asset owners that have set mandate-level decarbonisation targets. However, it can be adapted for use at total portfolio level across a range of asset classes and there is no need to have a decarbonisation target to undertake this analysis and take advantage of the insights it can offer.
Setting portfolio decarbonisation objectives
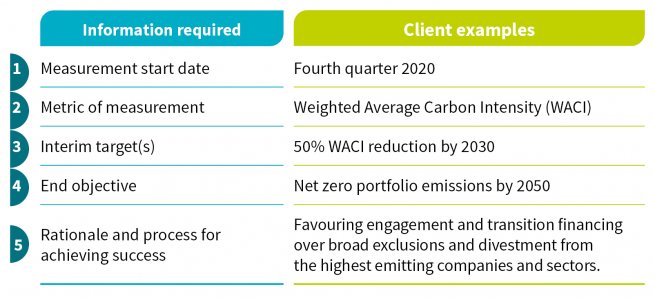
Many of our clients have set, or are looking to set, decarbonisation targets in the portfolios we manage on their behalf. To set these goals, just five pieces of information are required, set out below and illustrated with real-world examples from our work with a large pension fund client. This client has set a total portfolio objective of achieving net zero by 2050 and is looking to ensure their underlying portfolios are helping to achieve this goal:2
- VGhlIDIwMTUgUGFyaXMgQWdyZWVtZW50LCBzaWduZWQgYXQgQ09QMjEsIHNvdWdodCB0byBsaW1pdCBnbG9iYWwgd2FybWluZyB0byB3ZWxsIGJlbG93IDLLmiwgYW5kIHByZWZlcmFibHkgdG8gMS41y5ogQ2Vsc2l1cywgYWJvdmUgcHJlLWluZHVzdHJpYWwgbGV2ZWxzLg==
- VGhlIFdBQ0kgbWVhc3VyZXMgdGhlIHRvbm5lcyBvZiBDTzIgZXF1aXZhbGVudCBlbWl0dGVkIHBlciBtaWxsaW9uIGRvbGxhcnMvcG91bmRzL2V0YyBvZiByZXZlbnVlLg==
Once an objective is set, we can look at how it can be measured. Carbon intensity is heavily skewed towards the highest emitting issuers and sectors, as might be expected. For example, just 5% of a typical global credit portfolio can contribute 50% of the portfolio’s emissions. These high emitters are usually found in the energy, utility and basic materials sectors. By excluding these names, asset owners can quickly and easily decarbonise a portfolio. However, this simply moves the problem to another, potentially less responsible, asset owner and is unlikely to lead to worldwide decarbonisation. Our view tends towards the longer term, and we see value in seeking verifiable sustainable progression in the assets we hold.
‘Real’ decarbonisation?
That raises a key question: How can asset owners review whether portfolio decarbonisation has occurred through sales or through ‘real’ issuer-level decarbonisation?
To monitor progress against decarbonisation objectives we have created an emissions ‘waterfall’ which attributes the change in carbon intensity from one period to the next into the different factors listed below:
- New data/coverage – Each year, more issuers release their carbon emissions data publicly and this new information will impact the carbon intensity of a portfolio. New data from low emitters should reduce portfolio carbon intensity, and vice versa.
- Change of asset allocation – Portfolio turnover, new portfolio flows and any cashflow distributions will alter the asset allocation of the portfolio which then impacts the carbon intensity. Selling out of the highest emitting names will show up in this factor.
- Change in absolute emissions – This factor is the ‘real’ decarbonisation as it measures the emissions changes of the underlying issuers held in a portfolio. This is the primary driver of achieving net zero in the wider world.
- Changes in revenues – To calculate carbon intensity you divide absolute emissions by issuer revenues. Therefore, an increase in revenues will decrease portfolio carbon intensity, even if absolute emissions do not change. Similarly, a decrease in revenues, for example during a period of economic crisis, would increase portfolio carbon intensity.
- Residual – The residual factor is common in any attribution analysis and is the difference between the above factors and the total change in WACI. We would expect this to be small in absolute terms and not a material contributor to portfolio emissions changes.
In the client example above, the WACI reduced by 12.5% over the year. The main driver of this (-11%) was the fall in absolute emissions from a handful of large emitters within the portfolio. Interestingly, revenues for some high emitters were lower than the previous year, which increased the carbon intensity (+5%). The sale of one high-emitting issuer owing to our concerns over their plans to build a new coal plant resulted in a 5% drop in WACI. Overall, this 12.5% reduction and the key drivers of the change are broadly in line with our expectations, and we believe at a pace aligned to the goals of the Paris Agreement.
How might these factors change?
- New data: We expect coverage to increase over the coming years but then have a minimal impact on year-on-year emissions changes thereafter. The inclusion of some Scope 3 data and thereafter increasing coverage and accuracy of Scope 3 data will be a factor to consider in the future.3
- Asset allocation: While this factor should not be a material contributor to portfolio decarbonisation, if high emitters do not decarbonise in line with expectations, asset owners should have a plan of action ready. For example, AXA IM has a “three strikes” policy which we may use to divest from such names, and the resulting reduction in intensity would be reflected in this category.
- Absolute emissions: Issuer carbon emissions data is released on an annual basis and using this new data, we can calculate the change in absolute emissions for each issuer. This factor is heavily influenced by the highest carbon intensity names and therefore careful monitoring of these names is crucial. Low-emitting names have a negligible impact of absolute emissions reductions.
- Revenues: Although reducing absolute emissions is the ultimate goal in the decarbonisation journey, the world still needs economic growth. Therefore, if an issuer can produce more, and therefore earn higher revenues with the same carbon emissions, this can be considered a small success.
Active engagement with issuers is increasingly important to achieve decarbonisation objectives. It impacts each of the above factors, through building more resilient revenues, encouraging issuers to release more reliable emissions data and driving meaningful reductions in their absolute emissions. It enables portfolios managers to remain invested in transitioning companies and maintain a broad investible universe.
We note that the above case study has been done at mandate/portfolio level and can be applied at a total portfolio level as well by adding a further asset allocation factor into the calculation which accounts for any changes in the strategic asset allocation at the total portfolio level.
While this attribution provides the key drivers in portfolio decarbonisation over a period, as ever, the devil is in the detail. Drilling into each of the factors and the rationale for any large increases or decreases in carbon emissions at both the issuer- and portfolio-level will be the most useful exercise to assess the quality of portfolio decarbonisation. We expect our client meetings to focus more on this type of analysis now that a number of years of carbon emissions data is available for portfolios.
- U2NvcGUgMTogQWxsIGRpcmVjdCBncmVlbmhvdXNlIGdhcyAoR0hHKSBlbWlzc2lvbnMgbGlua2VkIHRvIGEgY29tcGFueeKAmXMgb3duIG9wZXJhdGlvbnMuIFNjb3BlIDI6IEluZGlyZWN0IEdIRyBlbWlzc2lvbnMgc3RlbW1pbmcgZnJvbSB0aGUgY29uc3VtcHRpb24gb2YgcHVyY2hhc2VkIGVsZWN0cmljaXR5LCBoZWF0IG9yIHN0ZWFtLiBTY29wZSAzOiBPdGhlciBpbmRpcmVjdCBlbWlzc2lvbnMgY29taW5nIGZyb20gdGhlIHN1cHBseSBjaGFpbiBvZiBhIGNvbXBhbnkgYW5kIGZyb20gaXRzIGN1c3RvbWVycyAoaS5lLiBiZWZvcmUgYW5kIGFmdGVyIGl0cyBvd24gb3BlcmF0aW9ucyku
Disclaimer
The information on this website is intended for investors domiciled in Switzerland.
AXA Investment Managers Switzerland Ltd (AXA IM) is not liable for unauthorised use of the website.
This website is for advertising and informational purpose only. The published information and expression of opinions are provided for personal use only. The information, data, figures, opinions, statements, analyses, forecasts, simulations, concepts and other data provided by AXA IM in this document are based on our knowledge and experience at the time of preparation and are subject to change without notice.
AXA IM excludes any warranty (explicit or implicit) for the accuracy, completeness and up-to-dateness of the published information and expressions of opinion. In particular, AXA IM is not obliged to remove information that is no longer up to date or to expressly mark it a such. To the extent that the data contained in this document originates from third parties, AXA IM is not responsible for the accuracy, completeness, up-to-dateness and appropriateness of such data, even if only such data is used that is deemed to be reliable.
The information on the website of AXA IM does not constitute a decision aid for economic, legal, tax or other advisory questions, nor may investment or other decisions be made solely on the basis of this information. Before any investment decision is made, detailed advice should be obtained that is geared to the client's situation.
Past performance or returns are neither a guarantee nor an indicator of the future performance or investment returns. The value and return on an investment is not guaranteed. It can rise and fall and investors may even incur a total loss.
AXA Investment Managers Switzerland Ltd.