
Managing drawdown risks in credit portfolios
- 22 May 2023 (7 min read)
Liquidity issues
That challenge reflects the fact it is difficult to buy or sell protection on an individual bond. And so our view is the first step should be to find a bond index which represents the portfolio’s exposure. The underlying idea is the potential credit spread shock of our bond portfolio is as close as possible to that of the index.
As an example of the kind of shock we’re referring to, during the COVID-19 crisis, the credit spread of the European Corporate Aggregate Bond iBoxx index increased by 200 basis points.4
One way to hedge the credit exposure is to trade total return swaps on the chosen bond index, whereby the investor receives the performance of the bond index over a given period and pays a fixed annual premium. However, one takeaway from the pandemic is the potential lack of liquidity of such derivatives in stressed conditions. Some investors were left with a significant exposure to a credit spread widening due to the limited size of the total return swaps market.
An alternative might be a credit default swap (CDS) on a global credit index. Traders were able to trade significant volumes of such derivatives even during the pandemic.
Single-name CDSs function as insurance against a default. The ‘protection buyer’ transfers the credit risk to the ‘protection seller’ in exchange for a premium. Should a company default, the buyer is compensated, for example by receiving the difference between the notional amount of the corporate bond and its recovery value from the protection seller.
A blended approach
This concept has been extended to a pool of entities, such as the iTraxx index in Europe and Asia and the CDX index in North America. The index CDS price corresponds to the average CDS price, or spread, of the most liquid firms.
The iTraxx5 Main index is the benchmark for the investment-grade segment of the European market. It comprises 125 firms across energy, banks, insurance, telecommunications, autos, industrials, consumer cyclical and non-cyclical firms. The iTraxx Crossover (sometimes known as ‘Xover’) is made up of high-yield European entities.
An index CDS trades in a similar way to a single-name CDS, but in the case of a company’s default, it would be removed from the pool. An investor would receive the protection on the defaulted name and continue to hold the protection against the remaining names. The pool composition is updated regularly to reflect changes in liquidity and credit quality.
However, the composition of the index covered by the CDS can be quite different from the names in an investor’s portfolio. One approach to address this issue is to use statistical techniques that seek to make good those discrepancies, as far as possible.
In the illustrative example below, the iBoxx Euro Corporate Aggregate Index plays the role of our credit strategy. Its asset swap spread – the difference between the bond yield and the swap rate with similar maturity – is used as a proxy for credit risk. We then set it against the credit spread – or rather the cost of insuring the names within – for both the iTraxx Main and the iTraxx Crossover.
The key finding is that there appears to be, in this example, a positive correlation between CDS spreads and the bond index asset swap spread. In normal market conditions, the bond index asset swap spread dynamic is close to that of the iTraxx Main dynamics, while in stressed market conditions (during COVID-19 for instance), it is closer to that of the iTraxx Crossover.
This implies we should be able to combine CDSs on investment-grade and high-yield indices, effectively calibrating the weightings of each in a bid to neutralise as far as possible the credit spread risk for a specific portfolio.
How credit risk changes according to market conditions
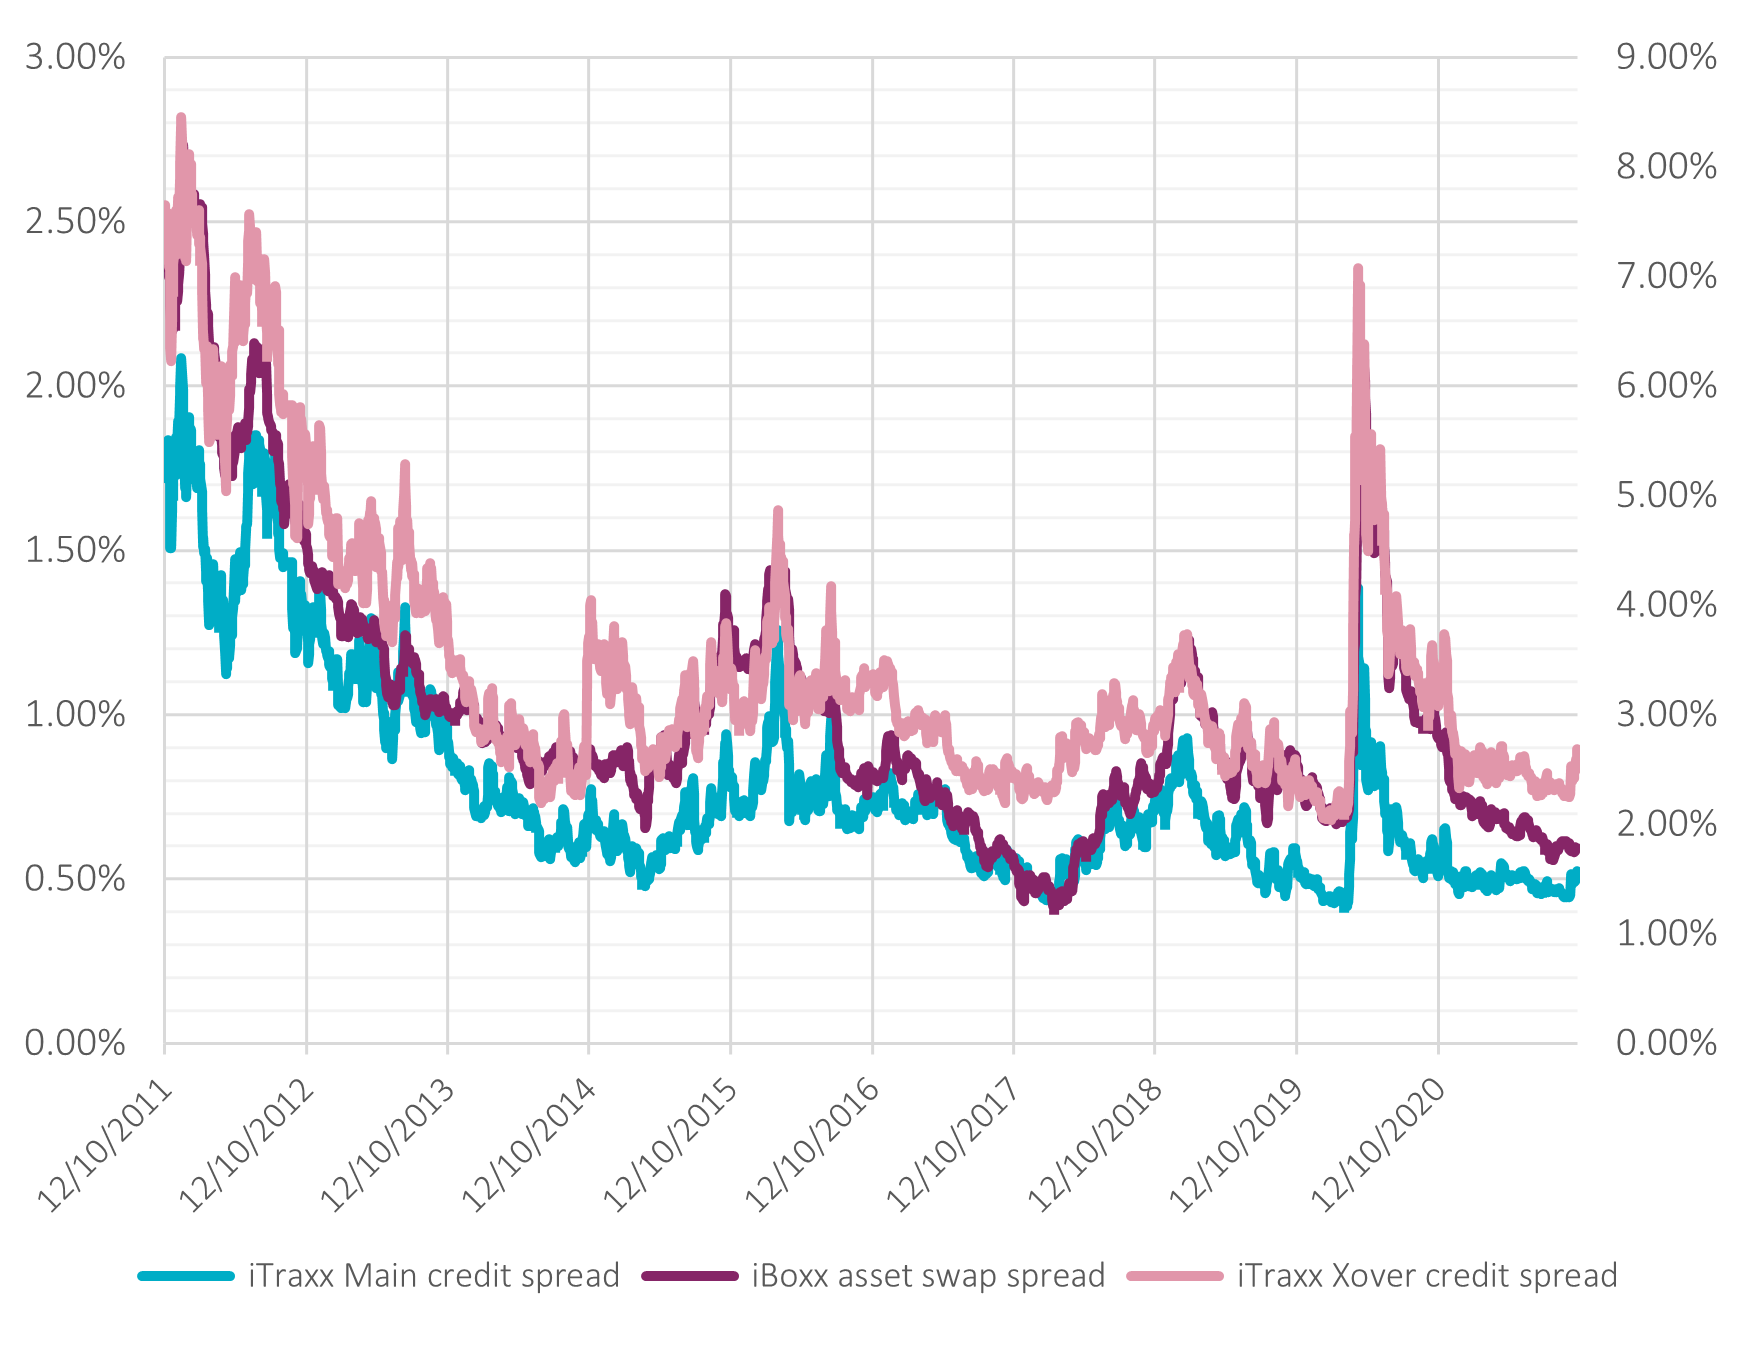
Source: For illustrative purposes only. Bloomberg, AXA IM. Retrieved April 2023
Putting it into practice: Hedging rate and spread risks
So how can we show this in action? As an illustrative case study, we can let the iBoxx Euro Corporate Aggregate once again play the role of our model portfolio, and we can use the hedging techniques described to try and understand the potential effects.1 The duration of this index is around five years and is stable over time. We use the following derivatives as hedging instruments:
As an interest rate risk hedge, we use a rolling interest rate swap with five-year maturity where we pay a fixed rate and receive the floating rate. Hence, when rates increase, the interest rate swap value increases to compensate the potential loss from the bond portfolio
- A rolling five-year CDS on the iTraxx Main investment grade index where we buy the protection and pay the annual premium
- A rolling five-year CDS on the iTraxx Xover high yield index where we buy the protection and pay the annual premium
- The weights of iTraxx Main and iTraxx Crossover in this mix should be updated daily, and their calibration should account for both normal and stressed conditions. It is also important to include a ‘memory effect’. This means the weight calculation should learn from recent crises but should ‘forget’ it gradually over time as we move back to more normal conditions. This process is designed to ensure that the approach is viable in both normal and stressed market conditions.
As a result, the iTraxx Crossover was underweighted in this example from 2011 until early 2019, while it increased gradually in early 2020. The weighting then stabilises after the COVID-19 crisis period, which is itself included in future calculations, so the hedge is still reactive in potential future crises.
Our theoretical back-test of the hedging strategy over the last decade (including the pandemic) is shown below. The red line shows the absolute level of the iBoxx index (called ‘unhedged portfolio’ in the chart). The green line shows the hedged alternative.
During the COVID-19 crisis we can see from the earlier chart that the iBoxx asset swap spread (our proxy for credit risk) widened by +2% . As the iBoxx has a five-year duration, the corresponding loss would be -10% as we can see in in the chart below.2 However, in this illustrative example the hedging derivatives described allowed us to mitigate the loss as they delivered +5%. The hedged strategy’s potential loss would therefore be -5% during the same period.3
The back-test implies this suggested approach can work to reduce drawdown risk. Simply put, if interest rates or the credit spread increase, the value of the derivatives should act to compensate. An investor might use a trigger point to set the conditions under which the strategy is deployed, meaning costs (the CDS premia) are only incurred if the trigger point is reached.
Of course, if rates or the credit spread decrease, the bond value increases but the derivatives value decreases, thus the performance of the hedged portfolio could be negatively impacted. If a client is concerned about such an eventuality there are other options for addressing these risks.
Hedging back-test of the 'portfolio' (iBoxx Euro Corporate Aggregate index)
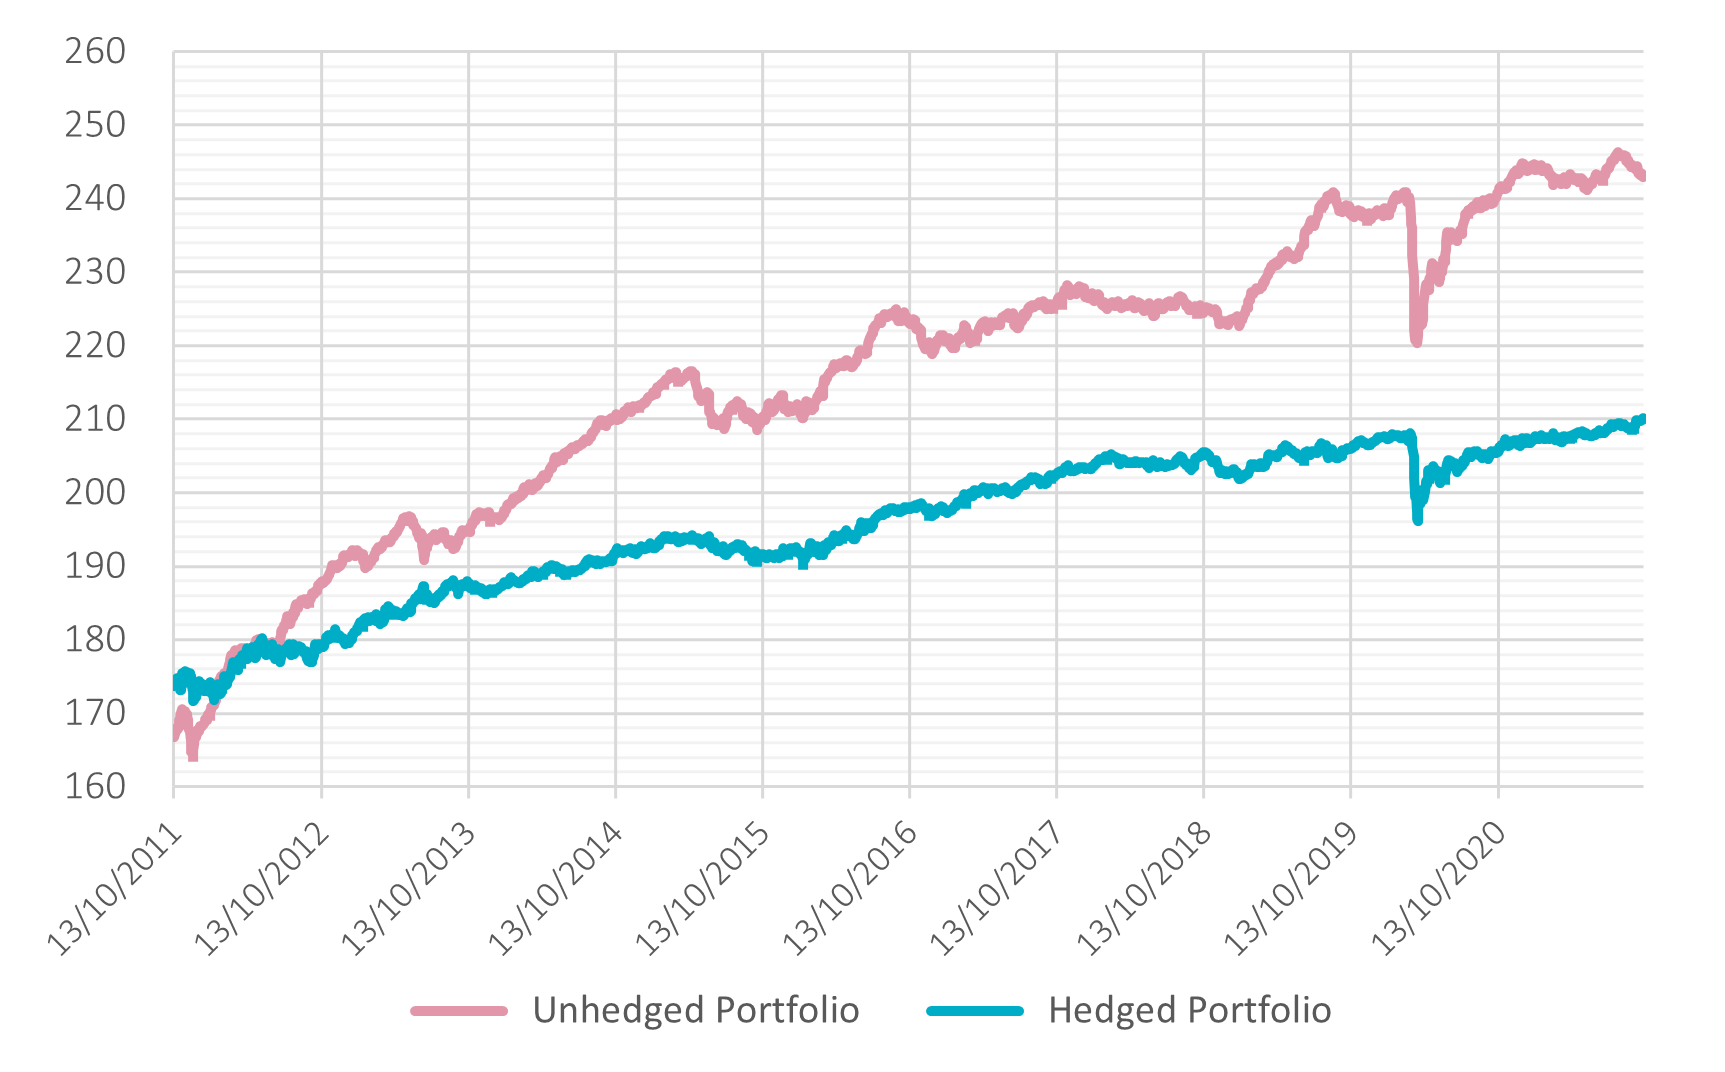
Source: AXA IM internal data, Bloomberg, retrieved April 2023
Finding a balance
The goal here, ultimately, is to minimise drawdowns and foster more stable return profiles. In turn that should mean clients are potentially less likely to sell at distressed prices and avoid crystallising losses in their credit portfolio.
Interest rate risk is generally relatively simple to address in credit portfolios but dealing with the risk that credit spreads widen, and damage valuations, is more difficult.
Total return swaps might look like a useful tool to do this as they allow to swap the bond index performance against an annual premium. But the pandemic revealed potential liquidity issues. Instead, we think investors could potentially consider a blended/hybrid strategy that uses investment grade and high yield index CDSs to build a hedge that closely resembles the risk profile of the portfolio in question.
Depending on the portfolio, global CDS indices should be carefully chosen to be as close as possible to the portfolio’s composition. A good balance between investment-grade index and high-yield index could mitigate the potential portfolio loss in both normal and stressed market conditions.
- U291cmNlOiBCbG9vbWJlcmcsIHJldHJpZXZlZCBBcHJpbCAyMDIz
- Q0RTIEluZGljZXMgUHJpbWVyLCBJSFMgTWFya2l0LCBOb3ZlbWJlciAyMDIx
- TWFya2l0IGlCb3h4wq4gRVVSIEJlbmNobWFyayBJbmRleCwgSUhTIE1hcmtpdCwgMjAxOQ==
- QVhBIElNIHJlc2VhcmNoLCBBcHJpbCAyMDIz
- UGFzdCBwZXJmb3JtYW5jZSBpcyBub3QgYSBndWlkZSB0byBjdXJyZW50IG9yIGZ1dHVyZSByZXN1bHRzLiBUaGUgdmFsdWUgb2YgaW52ZXN0bWVudHMsIGFuZCB0aGUgaW5jb21lIGZyb20gdGhlbSwgY2FuIGZhbGwgYXMgd2VsbCBhcyByaXNlIGFuZCBpbnZlc3RvcnMgbWF5IG5vdCBnZXQgYmFjayB0aGUgYW1vdW50IG9yaWdpbmFsbHkgaW52ZXN0ZWQuIEV4Y2hhbmdlLXJhdGUgZmx1Y3R1YXRpb25zIG1heSBhbHNvIGFmZmVjdCB0aGUgdmFsdWUgb2YgdGhlaXIgaW52ZXN0bWVudC4=
Disclaimer
The information on this website is intended for investors domiciled in Switzerland.
AXA Investment Managers Switzerland Ltd (AXA IM) is not liable for unauthorised use of the website.
This website is for advertising and informational purpose only. The published information and expression of opinions are provided for personal use only. The information, data, figures, opinions, statements, analyses, forecasts, simulations, concepts and other data provided by AXA IM in this document are based on our knowledge and experience at the time of preparation and are subject to change without notice.
AXA IM excludes any warranty (explicit or implicit) for the accuracy, completeness and up-to-dateness of the published information and expressions of opinion. In particular, AXA IM is not obliged to remove information that is no longer up to date or to expressly mark it a such. To the extent that the data contained in this document originates from third parties, AXA IM is not responsible for the accuracy, completeness, up-to-dateness and appropriateness of such data, even if only such data is used that is deemed to be reliable.
The information on the website of AXA IM does not constitute a decision aid for economic, legal, tax or other advisory questions, nor may investment or other decisions be made solely on the basis of this information. Before any investment decision is made, detailed advice should be obtained that is geared to the client's situation.
Past performance or returns are neither a guarantee nor an indicator of the future performance or investment returns. The value and return on an investment is not guaranteed. It can rise and fall and investors may even incur a total loss.
AXA Investment Managers Switzerland Ltd.