
Market rebound: New year beta bounce brings hope for recovery
- 10 February 2023 (7 min read)
Key points
- More upbeat sentiment has driven a sharp relief rally in the stocks and sectors which underperformed for much of 2022
- However low volatility stocks have significantly lagged the wider market rally
- Previous rallies of this nature have often been followed by a wider market recovery
Following a highly challenging 2022, markets appear to have regained their composure so far in 2023– major bond and equity indices are in positive territory year-to-date, while the UK’s blue-chip FTSE 100 has even hit a new high.1
Amid this new year wave of respite for embattled investors, we have noticed some very large moves in the relative performance of some popular investment styles – particularly over the last 30 days.
It’s not unusual for Low Volatility shares, i.e., typically defensive stocks, to lag the market during a sharp rally. However, the recent level of underperformance experienced, has in our view, been highly significant. For example, the MSCI Global Minimum Volatility Index (which focuses on low beta stocks) has underperformed the global market by more than 7% in the last 30 days.2
As the chart below highlights, comparable levels of relative weakness are quite unusual and historically have marked major market events. Examples include the recovery following the dotcom boom and bust of the early 2000s, or the rally that followed the global financial crisis after markets hit their nadir in March 2009. More recently, we saw a similar event in November 2020 when Pfizer announced it had successfully developed a COVID-19 vaccine.
30-day percentage change in MSCI World Minimum Volatility Index relative to the market
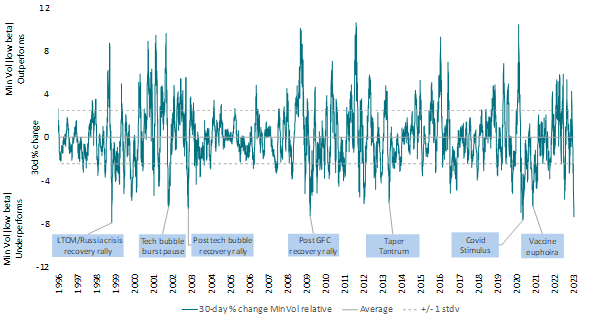
Source: AXA IM EQI, MSCI, Refinitiv Datastream, as of 8 February 2023
High momentum stocks – those with a positive price change, relative to the market, over the last 12 months - have also suffered a large level of relative drawdown in the past 30 days. The trend-following nature of Momentum meant that over the course of the last year it had become increasing correlated with lower beta stocks.
Low Volatility and Momentum drawdowns don’t always occur at the same time and indeed the magnitude that both have experienced over the last 30 days is rarer still.
What’s the driver and what’s next?
Unlike the financial crisis recovery or the coronavirus vaccine discovery, the current rally and associated factor dramatics do seem to have less obvious catalysts. What has changed in the first part of 2023 is sentiment. It has vastly improved in the wake of China’s re-opening, easing inflation and a downgrading of the likelihood of economic recession in the US and Europe – together they have driven a sharp relief rally in the stocks, sectors and investment styles (i.e. factors) that underperformed for much of last year.
Historically, low beta weakness or high beta rallies of this magnitude have generally been a positive market signal. The table below details subsequent 130-day and 260-day returns of the MSCI World Index following periods when the MSCI Minimum Volatility Index experienced similar levels of weakness as they have so far in 2023.
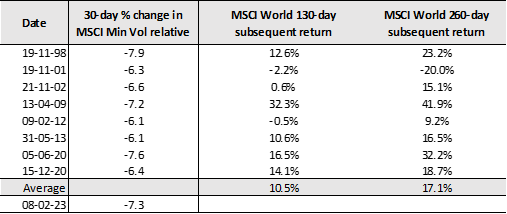
Source: AXA IM EQI, MSCI, Refinitiv Datastream, as of 8 February 2023
Of course, there are exceptions to which investors should pay close attention. In 2001 the market rallied after significant falls from tech bubble highs; however, this proved to be a false start and markets went on to fall further. It’s also worth noting the low-quality nature of the current recovery; through a deeper dive into the data of the outperforming high beta stocks, we find it’s ‘lower quality-high beta’ stocks that have led the market.
Historically, our observation is that it is not unusual for ‘lower quality-high beta’ to lead a relief rally. But we also note that these phases of market rallies, while intense, have historically tended to be brief. Furthermore, such stocks historically have not been the source of a sustained market rally.
It is of course important to note that simply looking at past performance patterns ignores important differences in macroeconomic conditions and market valuation, so in isolation should not be seen a guide to future returns. But after the drawdown seen in equity markets over 2022, signs of hope are to be welcomed.
- UmVmaW5pdGl2IERhdGFzdHJlYW0gLCBkYXRhIGFzIGF0IDggRmVicnVhcnkgMjAyMyAvIEZUU0UgMTAwIGhpdHMgcmVjb3JkIGhpZ2ggfCBGVFNFIHwgVGhlIEd1YXJkaWFu
- QVhBIElNIEVRSSwgTVNDSSwgUmVmaW5pdGl2IERhdGFzdHJlYW0sIGFzIG9mIDggRmVicnVhcnkgMjAyMw==
Disclaimer
The information on this website is intended for investors domiciled in Switzerland.
AXA Investment Managers Switzerland Ltd (AXA IM) is not liable for unauthorised use of the website.
This website is for advertising and informational purpose only. The published information and expression of opinions are provided for personal use only. The information, data, figures, opinions, statements, analyses, forecasts, simulations, concepts and other data provided by AXA IM in this document are based on our knowledge and experience at the time of preparation and are subject to change without notice.
AXA IM excludes any warranty (explicit or implicit) for the accuracy, completeness and up-to-dateness of the published information and expressions of opinion. In particular, AXA IM is not obliged to remove information that is no longer up to date or to expressly mark it a such. To the extent that the data contained in this document originates from third parties, AXA IM is not responsible for the accuracy, completeness, up-to-dateness and appropriateness of such data, even if only such data is used that is deemed to be reliable.
The information on the website of AXA IM does not constitute a decision aid for economic, legal, tax or other advisory questions, nor may investment or other decisions be made solely on the basis of this information. Before any investment decision is made, detailed advice should be obtained that is geared to the client's situation.
Past performance or returns are neither a guarantee nor an indicator of the future performance or investment returns. The value and return on an investment is not guaranteed. It can rise and fall and investors may even incur a total loss.
AXA Investment Managers Switzerland Ltd.