
Quantifying the greenium
- 18 July 2022 (5 min read)
Despite a very challenging year for the fixed income market, green bond issuance managed to keep pace with the 2021 record. As at the end of June, $207bn1 of green bonds have been issued year-to-date, slightly above 2021 at the same time. 75 inaugural issuers1 have already joined the green bond market this year and one can expect many more in the near future as all sectors are progressively investing in the transition to a low-carbon economy. To navigate this buoyant market, investors need to be aware of the ‘greenium’ effect and how its impact can change depending on the sector and geography.
When Austria issued its debut green bond in May, it raised €4bn and attracted 25 billion orders2 . This demand enabled the bond to price at a slightly lower yield - circa 2.5bp -versus the existing Austrian conventional bond. This premium, known as ‘greenium’, is a trend that has been progressively materialising for some time, reflecting the imbalance between supply and demand. But it is important to recognise that the size of the greenium can vary and change over time. In particular, in the primary market activity, we’ve observed that when the level of issuance declines, as it is often the case during summer time or end-of-year period, the greenium increases.
Germany, for example, is expected to issue a new green bond later this year. When Germany issued its debut green bond in September 2020, it uniquely matched the green issue with a conventional bond with the same maturity. This gave us the first ever direct price comparison. At issue, the green bond priced 1 basis point more expensive than its conventional twin. Interestingly, that greenium has grown up to 7bps and is back to less than 2bps today. We see this as the reflection of lower demand for Fixed Income overall this year, which has not spared green bonds, yet in context for sustained supply compared to last year.
Few markets offer such a clean comparison but, by researching every segment of the green bond universe, we have calculated what should be the theoretical price of green bonds versus their conventional counterparts. For instance, focusing on euro green bond issuance, which provides the most comprehensive and less biased picture, we can clearly see that there is indeed a greenium, but it is not structural, and it is not equal everywhere. We estimate that the greenium is currently circa 6 basis points, with variations within that. For sovereign debt, we find that the greenium is around 10 basis points; for corporate debt it is around 7 basis points; and quasi-sovereign is around 3 basis points.
Different sectors offer different opportunities
Within corporate debt, there is a significant difference between sectors depending on the number of green bonds and issuers. Again, supply and demand dictate this premium: a sector like real estate, which has been particularly active over the past years and where investors can go elsewhere if the issue is considered expensive, has a greenium of around 2 basis points. The automotive sector, on the other hand, is a sector where there are fewer options and here the greenium is around 15 basis points.
EUR Corporate Greenium (bps)
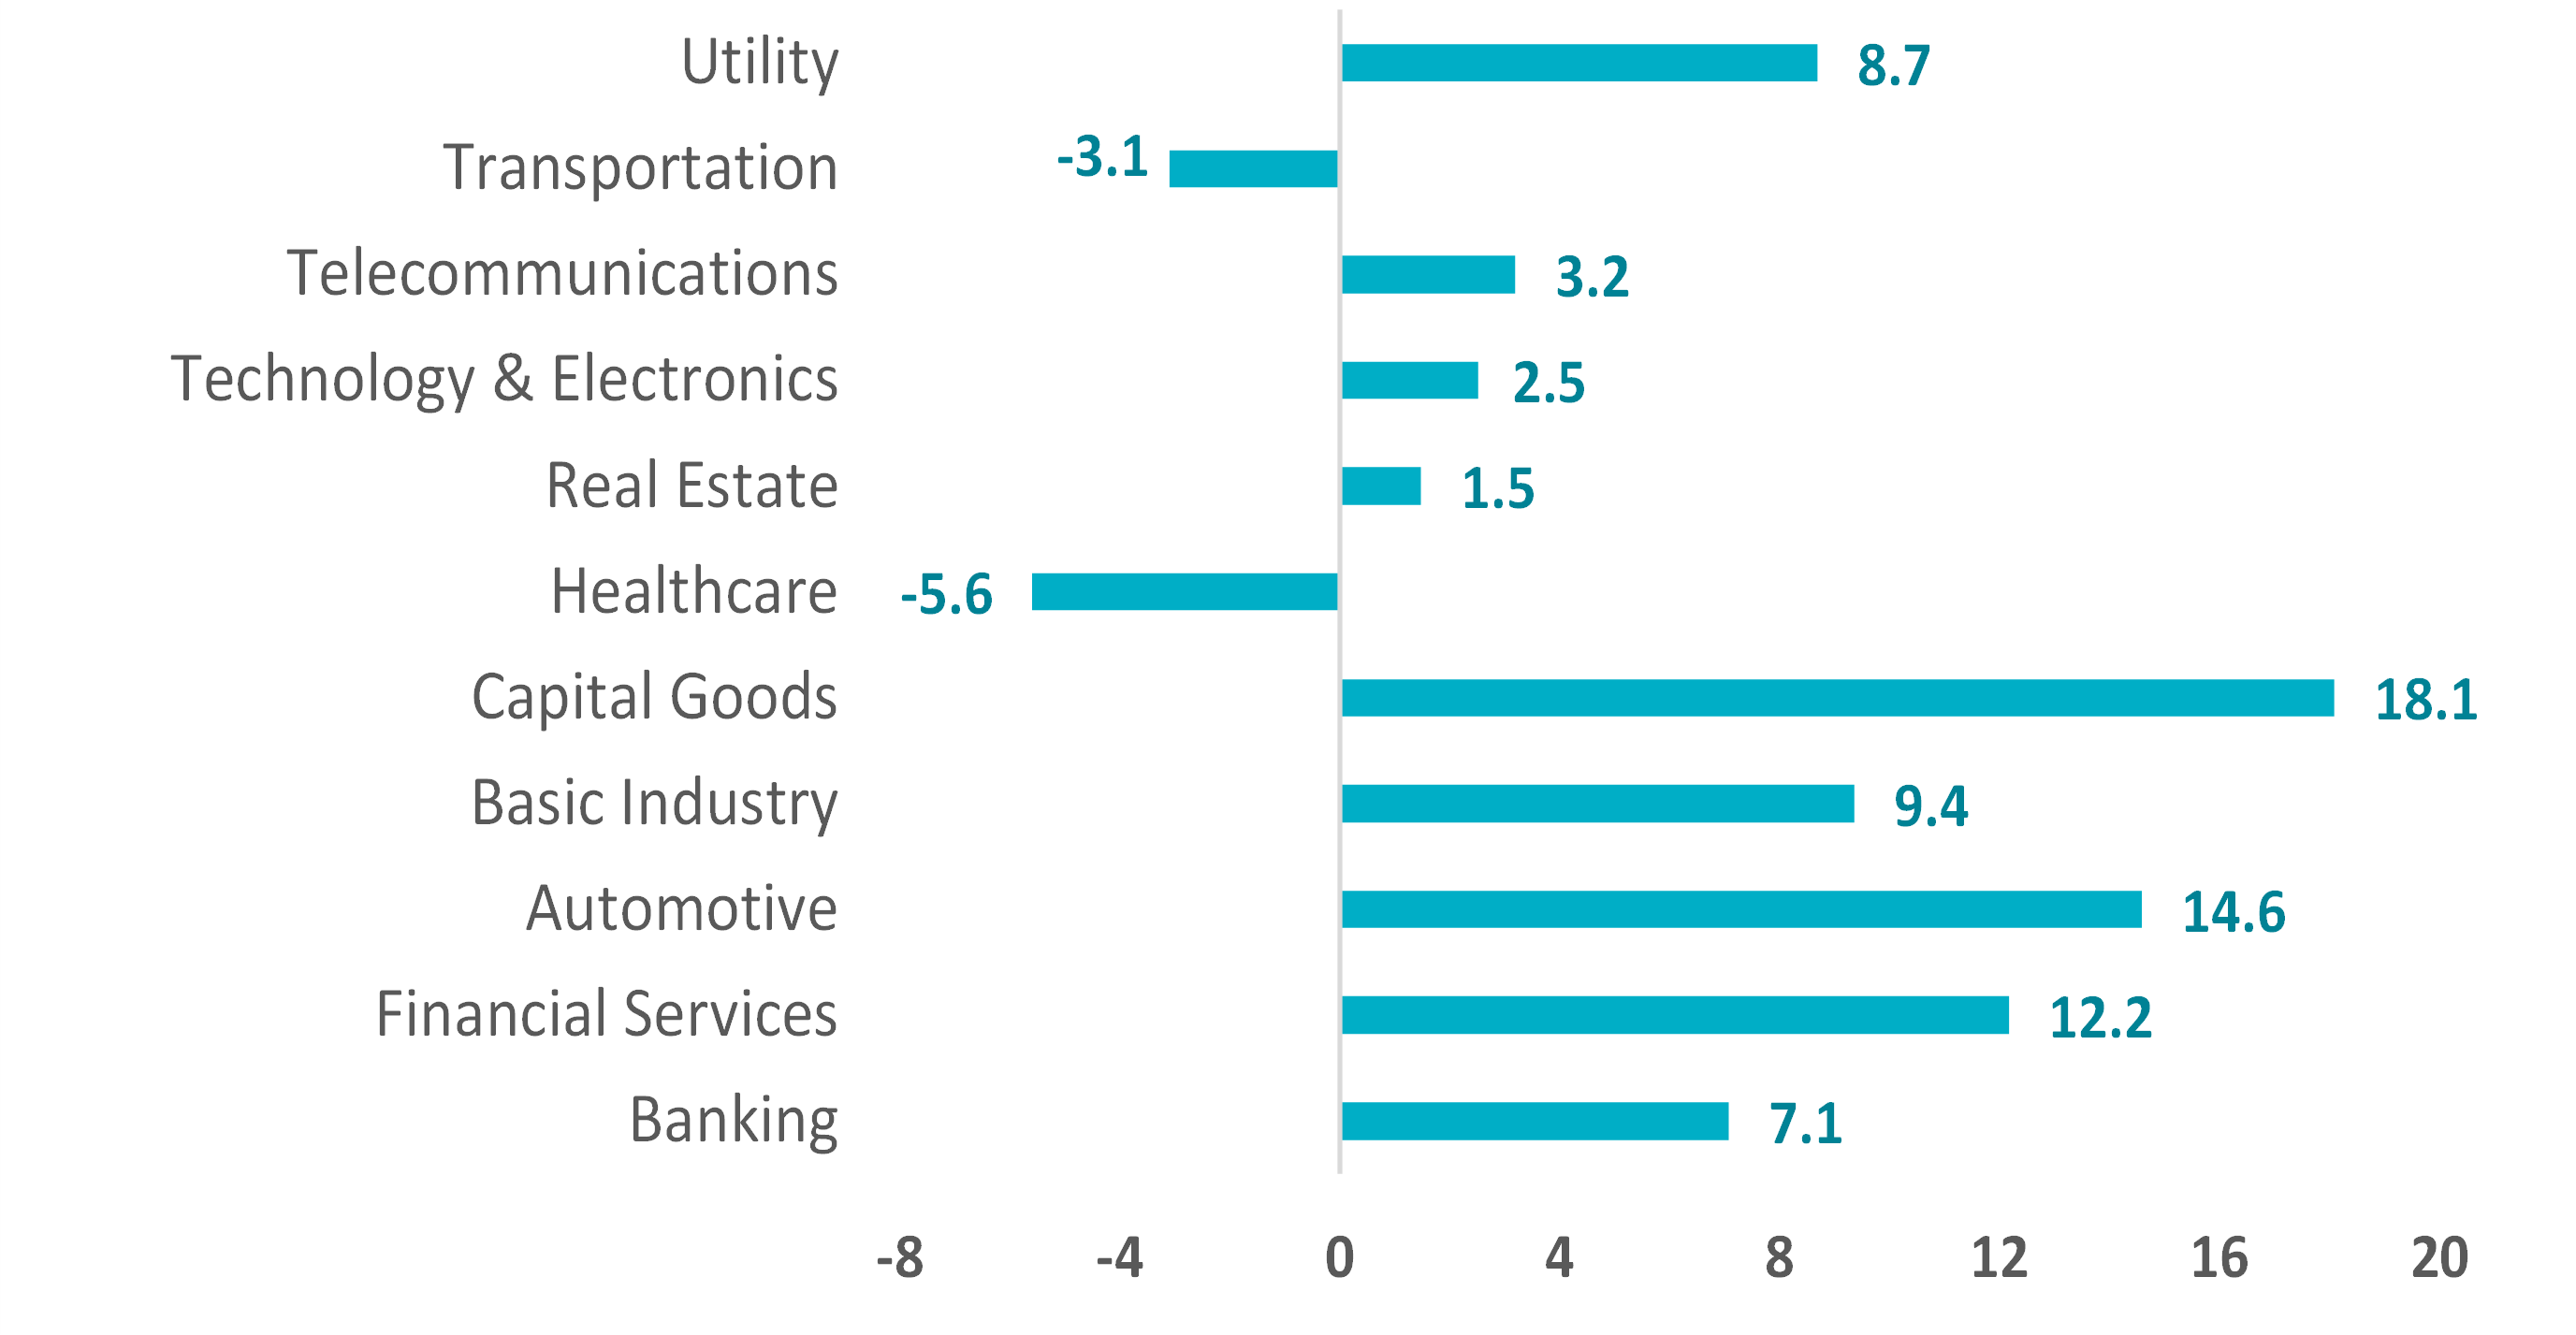
Source: AXA IM, Bloomberg as at 01/07/2022. Based on AXA IM proprietary Greenium valuation model using global aggregate bond universe. For illustrative purpose only.
It is interesting to note that the greenium can be affected by the regularity of issuance from single issuers in the corporate debt market: a green bond from an issuer that has not been active on that market for some time could prove to be relatively scarce and hard to find in the secondary market, translating into a larger greenium. Conversely, a recurring green bond issuer is likely to see its greenium come down reflecting a better supply and demand balance. It is clear that the more issuance from an issuer, the smaller the greenium.
In addition, 2022 market turmoil has brought us some additional insight about the greenium dynamics that we had already hinted at during previous phases of risk aversion. As credit spreads widen, greenium tends to increase, acting as a buffer against the general widening. Hence, the average greenium of the euro corporate market has grown from 3bps back in December 2021 to 6bps now. This highlights the long-term approach of green bond investors, holding to their bonds despite volatility, compared to conventional investors.
The greenium is here to stay
Paying a slight premium for a green bond can concern investors but it is important they remember they should benefit from a better risk-adjusted return over the long term. By providing potentially lower funding costs for green projects, issuers are investing in the transition to a low carbon economy and should be better fit to address the risks and opportunities that arise in a transitioning world.
The greenium is, however, another argument for investors to take an active and dynamic approach. As in any fixed income market, investors want to avoid expensive issues and gain additional performance from those bonds whose value (or greenium) rises after purchase. Green bonds offer a way for investors to contribute to financing the energy and ecology transition, and active management ensures they can do so most effectively and with the highest return on their investment.
- U291cmNlOiBBWEEgSU0sIEJsb29tYmVyZyBhcyBhdCAzMC8wNi8yMDIy
- U291cmNlOiBBWEEgSU0sIEJsb29tYmVyZyBhcyBhdCAzMC8wNi8yMDIy
- U291cmNlOiBSZXV0ZXJzIGFzIGF0IDI0LzA1LzIwMjI=
Disclaimer
The information on this website is intended for investors domiciled in Switzerland.
AXA Investment Managers Switzerland Ltd (AXA IM) is not liable for unauthorised use of the website.
This website is for advertising and informational purpose only. The published information and expression of opinions are provided for personal use only. The information, data, figures, opinions, statements, analyses, forecasts, simulations, concepts and other data provided by AXA IM in this document are based on our knowledge and experience at the time of preparation and are subject to change without notice.
AXA IM excludes any warranty (explicit or implicit) for the accuracy, completeness and up-to-dateness of the published information and expressions of opinion. In particular, AXA IM is not obliged to remove information that is no longer up to date or to expressly mark it a such. To the extent that the data contained in this document originates from third parties, AXA IM is not responsible for the accuracy, completeness, up-to-dateness and appropriateness of such data, even if only such data is used that is deemed to be reliable.
The information on the website of AXA IM does not constitute a decision aid for economic, legal, tax or other advisory questions, nor may investment or other decisions be made solely on the basis of this information. Before any investment decision is made, detailed advice should be obtained that is geared to the client's situation.
Past performance or returns are neither a guarantee nor an indicator of the future performance or investment returns. The value and return on an investment is not guaranteed. It can rise and fall and investors may even incur a total loss.
AXA Investment Managers Switzerland Ltd.