
Measuring energy: Losses and efficiencies with an electric silver lining
- 28 February 2024 (7 min read)
Key points:
- Energy is essential - it provides us with heat, lighting and the power to makes machines and engines run
- Society is however reliant on fossil fuels and harnessing nature where it can - biomass, wind, water and so on
- Two-thirds of the energy injected into the system is of no use - reducing those losses is possible through traditional efficiency gains and more significantly by electrifying processes and end uses
- There are ever-growing opportunities to invest in companies that can deliver energy efficiency gains and in the broad electrification ecosystem
The US Energy Information Administration defines energy as follows: “Scientists define energy as the ability to do work. Modern civilization is possible because people have learned how to change energy from one form to another and then use it to do work. People use energy for a variety of things, such as to walk and bicycle, to move cars along roads and boats through water, to cook food on stoves, to make ice in freezers, to light our homes and offices, to manufacture products, and to send astronauts into space.”1
In other words, energy is what brings us light, heat and motion.
Energy has also become a political as well as public priority; the pressure is on all economic players – and investors – to turn greener, which means we need to see a massive expansion of renewable energy. Ever-greater innovation in engineering and technology is helping to spearhead a drive towards global climate goals, which in turn is opening up more and more potential long-term investment opportunities.
Exhibit 1 is an insightful way to characterise the energy system from start to end and its practical meaning in our daily lives.
Exhibit 1: Heat and Work in the Global Energy System

Source: “From using heat to using work: reconceptualising the zero carbon energy transition”, Nick Eyre, Energy Efficiency, September 2021
One striking feature of society’s energy system is that it is still very inefficient, because we waste most of the energy. Take the US, where only one-third of the energy supplied is useful to the final user, for instance to move around, cook or run a factory.
Exhibit 2: US energy flows in 2022
Source: Energy Flow Charts | Flowcharts (llnl.gov). In units of energy (quads).
- PGEgaHJlZj0iaHR0cHM6Ly93d3cuZWlhLmdvdi9lbmVyZ3lleHBsYWluZWQvd2hhdC1pcy1lbmVyZ3kvIj5XaGF0IGlzIGVuZXJneT8gRW5lcmd5IGV4cGxhaW5lZCAtIFUuUy4gRW5lcmd5IEluZm9ybWF0aW9uIEFkbWluaXN0cmF0aW9uIChFSUEpPC9hPg==
Gap between supply and consumption
Fundamentally the majority, at 79%, of our energy still comes from fossil fuels2 . When coal, crude oil and natural gas are transformed into something useful – electricity, transportation fuels or heat – and when machines and engines are humming away, most of the energy ends up in heat, leaks away or is lost to friction.
A typical coal power plant has an energy yield of around 35%, meaning 65% of the energy content of the coal feedstock is lost. For a modern combined-cycle gas plant, the loss is ‘only’ around 55% and best in class is below 40%3 .
To better understand this let’s start with a few definitions as set out below:
Supply
- Primary Energy or Total Energy Supply (TES): All energy products that are not transformed and directly exploited. This mainly includes crude oil, natural gas, coal, biomass, solar radiation, hydraulic energy, wind energy, geothermic energy and the energy taken from uranium fission
- Secondary Energy: All energy obtained from converting primary energy into a transportable form. This mainly includes electricity from fossil fuels and uranium, liquid fuels such as gasoline or diesel, and heat
Consumption
- Final Energy or Total Final Consumption (TFC): The energy that end-users buy and receive, such as electricity at home or gasoline at a service station
- Useful Energy or Energy Services: The energy that is available to end-users to satisfy their needs; it is the energy service provided. It is a fraction of TFC. For instance, for a car, a truck, or a plane, it is the movement of the vehicle; or it is the heat provided by a gas boiler.
- SUVBLCBXb3JsZCBFbmVyZ3kgT3V0bG9vayAyMDIzLCBPY3RvYmVyIDIwMjM=
- PGEgaHJlZj0iaHR0cHM6Ly93d3cuZ2V2ZXJub3ZhLmNvbS9nYXMtcG93ZXIvcmVzb3VyY2VzL2FydGljbGVzLzIwMTgvbmlzaGktbmFnb3lhLWVmZmljaWVuY3ktcmVjb3JkIj5CcmVha2luZyB0aGUgcG93ZXIgcGxhbnQgZWZmaWNpZW5jeSByZWNvcmQgYWdhaW4gfCBHRSBHYXMgUG93ZXI8L2E+
The International Energy Agency (IEA) provides detailed energy data documenting the evolution of supply (TES) and consumption (TFC) and the gap between them. In the graph below you can see in detail where and how energy is lost.
Exhibit 3: From supply to consumption 
Source: IEA, World Energy Balances Highlights, September 2023 (in exajoules)
CHP: Combined Heat & Power
This chart tells a clear story:
- A significant part of the energy supply is lost in conversion
- More than 60% of the losses are generated when producing electricity and heat
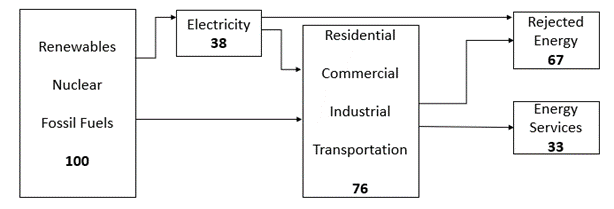
In addition to the losses between primary energy and final consumption, there are additional losses between final consumption and useful energy, i.e., the energy that is actually used by the end customer. Think for instance about gasoline heating an automotive engine – useless – as well as moving the car – useful. This is shown in Exhibit 4. Ultimately, about two-thirds of primary energy is rejected, i.e., it is of no use to society.
Exhibit 4: From primary to useful energy

Sources: IEA, EIA, Lawrence Livermore National Laboratory
The drive for efficiency
The logical question is how to change this. How can we increase the share of useful energy and reduce waste? While the laws of physics cannot be beaten, there are ways to improve the situation – namely through two key and interconnected levers: efficiency and electrification.
It is no coincidence that one of the conclusions of 2023’s United Nations climate change conference COP28 was to call for “tripling renewable energy capacity globally and doubling the global average annual rate of energy efficiency improvements by 2030”.4
Efficiency is about having the same output for a lower energy consumption, or more output for the same energy consumption. According to the IEA, energy efficiency has improved by slightly above 1% per annum over the past 20 years,5 with better results in recent years. In practice, the COP28 agreement, including a dedicated pledge on efficiency calls for achieving 4% annual efficiency gains.6
To do so, the right policy is required to support more efficient solutions, for instance better housing insulation, access to still-expensive electric cars, or public transportation. Policy also ought to support electrification more broadly. It makes sense to incentivise industries and people to go electric, because an electricity-powered machine is always more efficient than a fossil fuel-powered machine.
Exhibit 5 compares energy efficiency of electric and fossil fuel pathways for several products and equipment. The data is at the point of consumption and does not factor in losses and inefficiencies (such as power losses in the grid or energy consumption of converting crude oil into refined products).
- PGEgaHJlZj0iaHR0cHM6Ly91bmZjY2MuaW50L3NpdGVzL2RlZmF1bHQvZmlsZXMvcmVzb3VyY2UvY21hMjAyM19MMTdfYWR2LnBkZiI+Q09QMjggLSBPdXRjb21lIG9mIHRoZSBmaXJzdCBnbG9iYWwgc3RvY2t0YWtlLCBVTkZDQywgMTMgRGVjZW1iZXIgMjAyMzwvYT4=
- PGEgaHJlZj0iaHR0cHM6Ly9pZWEuYmxvYi5jb3JlLndpbmRvd3MubmV0L2Fzc2V0cy9kZmQ5MTM0Zi0xMmViLTQwNDUtOTc4OS05ZDZhYjhkOWZiZjQvRW5lcmd5RWZmaWNpZW5jeTIwMjMucGRmIj5FbmVyZ3kgRWZmaWNpZW5jeSAyMDIzLCBJRUEsIE5vdmVtYmVyIDIwMjM8L2E+
- PGEgaHJlZj0iaHR0cHM6Ly93d3cuY29wMjguY29tL2VuL2dsb2JhbC1yZW5ld2FibGVzLWFuZC1lbmVyZ3ktZWZmaWNpZW5jeS1wbGVkZ2UjOn46dGV4dD1Db21taXQlMjB0byUyMHdvcmslMjB0b2dldGhlciUyMGluLHBsYW5uaW5nJTJDJTIwYW5kJTIwbWFqb3IlMjBpbnZlc3RtZW50JTIwZGVjaXNpb25zIj5DT1AyODogR2xvYmFsIFJlbmV3YWJsZXMgYW5kIEVuZXJneSBFZmZpY2llbmN5IFBsZWRnZTwvYT4=
Exhibit 5: Energy efficiency or energy out relative to energy in
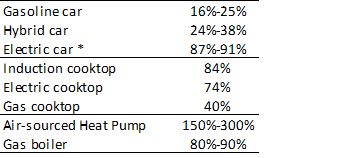
Sources: IEA, EIA, Lawrence Livermore National Laboratory
For a car with a gasoline engine, the US Environmental Protection Agency7 estimates that no more than 16% to 25% of the energy is used to move the car. For a pure electric car, the ratio is 87% to 91%, and 65% to 69% without regenerative braking.
Overall, electrification eliminates, or strongly reduces, heat losses and leakages along the energy chain.
In addition, if the electricity is renewable, i.e., not based on fossil fuels, then conversion losses from primary to secondary energy are also eliminated. It is however not all green as solar and wind farms have lower capacity factors.
This is why we deem electrification and efficiency to be interconnected levers.
Hence, considering an energy transition general pathway, the logic would be to:
- Electrify what can be: light and medium-duty transportation; some heavy-duty transportation; heating, ventilation and air conditioning; engines and motors; low and medium industrial heat
- Decarbonise electricity production
- Tackle areas where electricity is not the solution: high temperature industrial heat (more than 850°C); aviation; long-haul shipping; certain heavy duty on and off-road equipment.
The main options are to be found in bioenergy, hydrogen, or e-fuels
From an investor point of view, this means that there are opportunities to invest in companies that can deliver energy efficiency gains and in the broad electrification ecosystem. Those are far from being new trends, but they are structural and provide long-term visibility.
- PGEgaHJlZj0iaHR0cHM6Ly93d3cuZnVlbGVjb25vbXkuZ292L2ZlZy9hdHYuc2h0bWwiPldoZXJlIHRoZSBFbmVyZ3kgR29lczogR2Fzb2xpbmUgVmVoaWNsZXMgKGZ1ZWxlY29ub215Lmdvdik8L2E+
Disclaimer
The information on this website is intended for investors domiciled in Switzerland.
AXA Investment Managers Switzerland Ltd (AXA IM) is not liable for unauthorised use of the website.
This website is for advertising and informational purpose only. The published information and expression of opinions are provided for personal use only. The information, data, figures, opinions, statements, analyses, forecasts, simulations, concepts and other data provided by AXA IM in this document are based on our knowledge and experience at the time of preparation and are subject to change without notice.
AXA IM excludes any warranty (explicit or implicit) for the accuracy, completeness and up-to-dateness of the published information and expressions of opinion. In particular, AXA IM is not obliged to remove information that is no longer up to date or to expressly mark it a such. To the extent that the data contained in this document originates from third parties, AXA IM is not responsible for the accuracy, completeness, up-to-dateness and appropriateness of such data, even if only such data is used that is deemed to be reliable.
The information on the website of AXA IM does not constitute a decision aid for economic, legal, tax or other advisory questions, nor may investment or other decisions be made solely on the basis of this information. Before any investment decision is made, detailed advice should be obtained that is geared to the client's situation.
Past performance or returns are neither a guarantee nor an indicator of the future performance or investment returns. The value and return on an investment is not guaranteed. It can rise and fall and investors may even incur a total loss.
AXA Investment Managers Switzerland Ltd.