

Why opportunities to diversify within fixed income matter more than ever
KEY POINTS
The geopolitical landscape continues to evolve, and uncertainties in the economic backdrop are also rising. In this environment of global fragmentation and market volatility, diversification has once again come to the forefront for building a portfolio. But a diversified portfolio doesn’t just mean a mix of equities and bonds. Fixed income itself is a broad and deep universe offering myriad opportunities to diversify within the asset class, for example by credit quality, geography, or maturity.
Bond performance is influenced by two key factors – interest rates and credit spreads (the yield premium over higher rated bonds of similar maturity). Although the relationship between these two factors can be positively correlated in certain periods, the typical reversion to naturally negative correlation offers potential diversification benefits through a blend of rates and riskier assets.
The impact of spreads
Despite the uncertain backdrop, credit spreads are currently at historically low levels and had reached their tightest levels all year by the end of July 2025. This tightening has helped high beta asset classes outperform a diversified portfolio
Indeed, looking at historical data, when spreads were at similarly tight levels, there was a significantly higher probability that they would widen within the next one year. Using euro high yield (‘HY’) as an example, the chance of widening is currently 81%, with potential increases in spread of up to 341 basis points (bp). Conversely, the probability of tightening is only 19%, with maximum decreases of 125 bp. Similar results have been observed for euro credit investment grade (IG), with an 80% probability of widening in spread and a notable asymmetry favouring the upside.
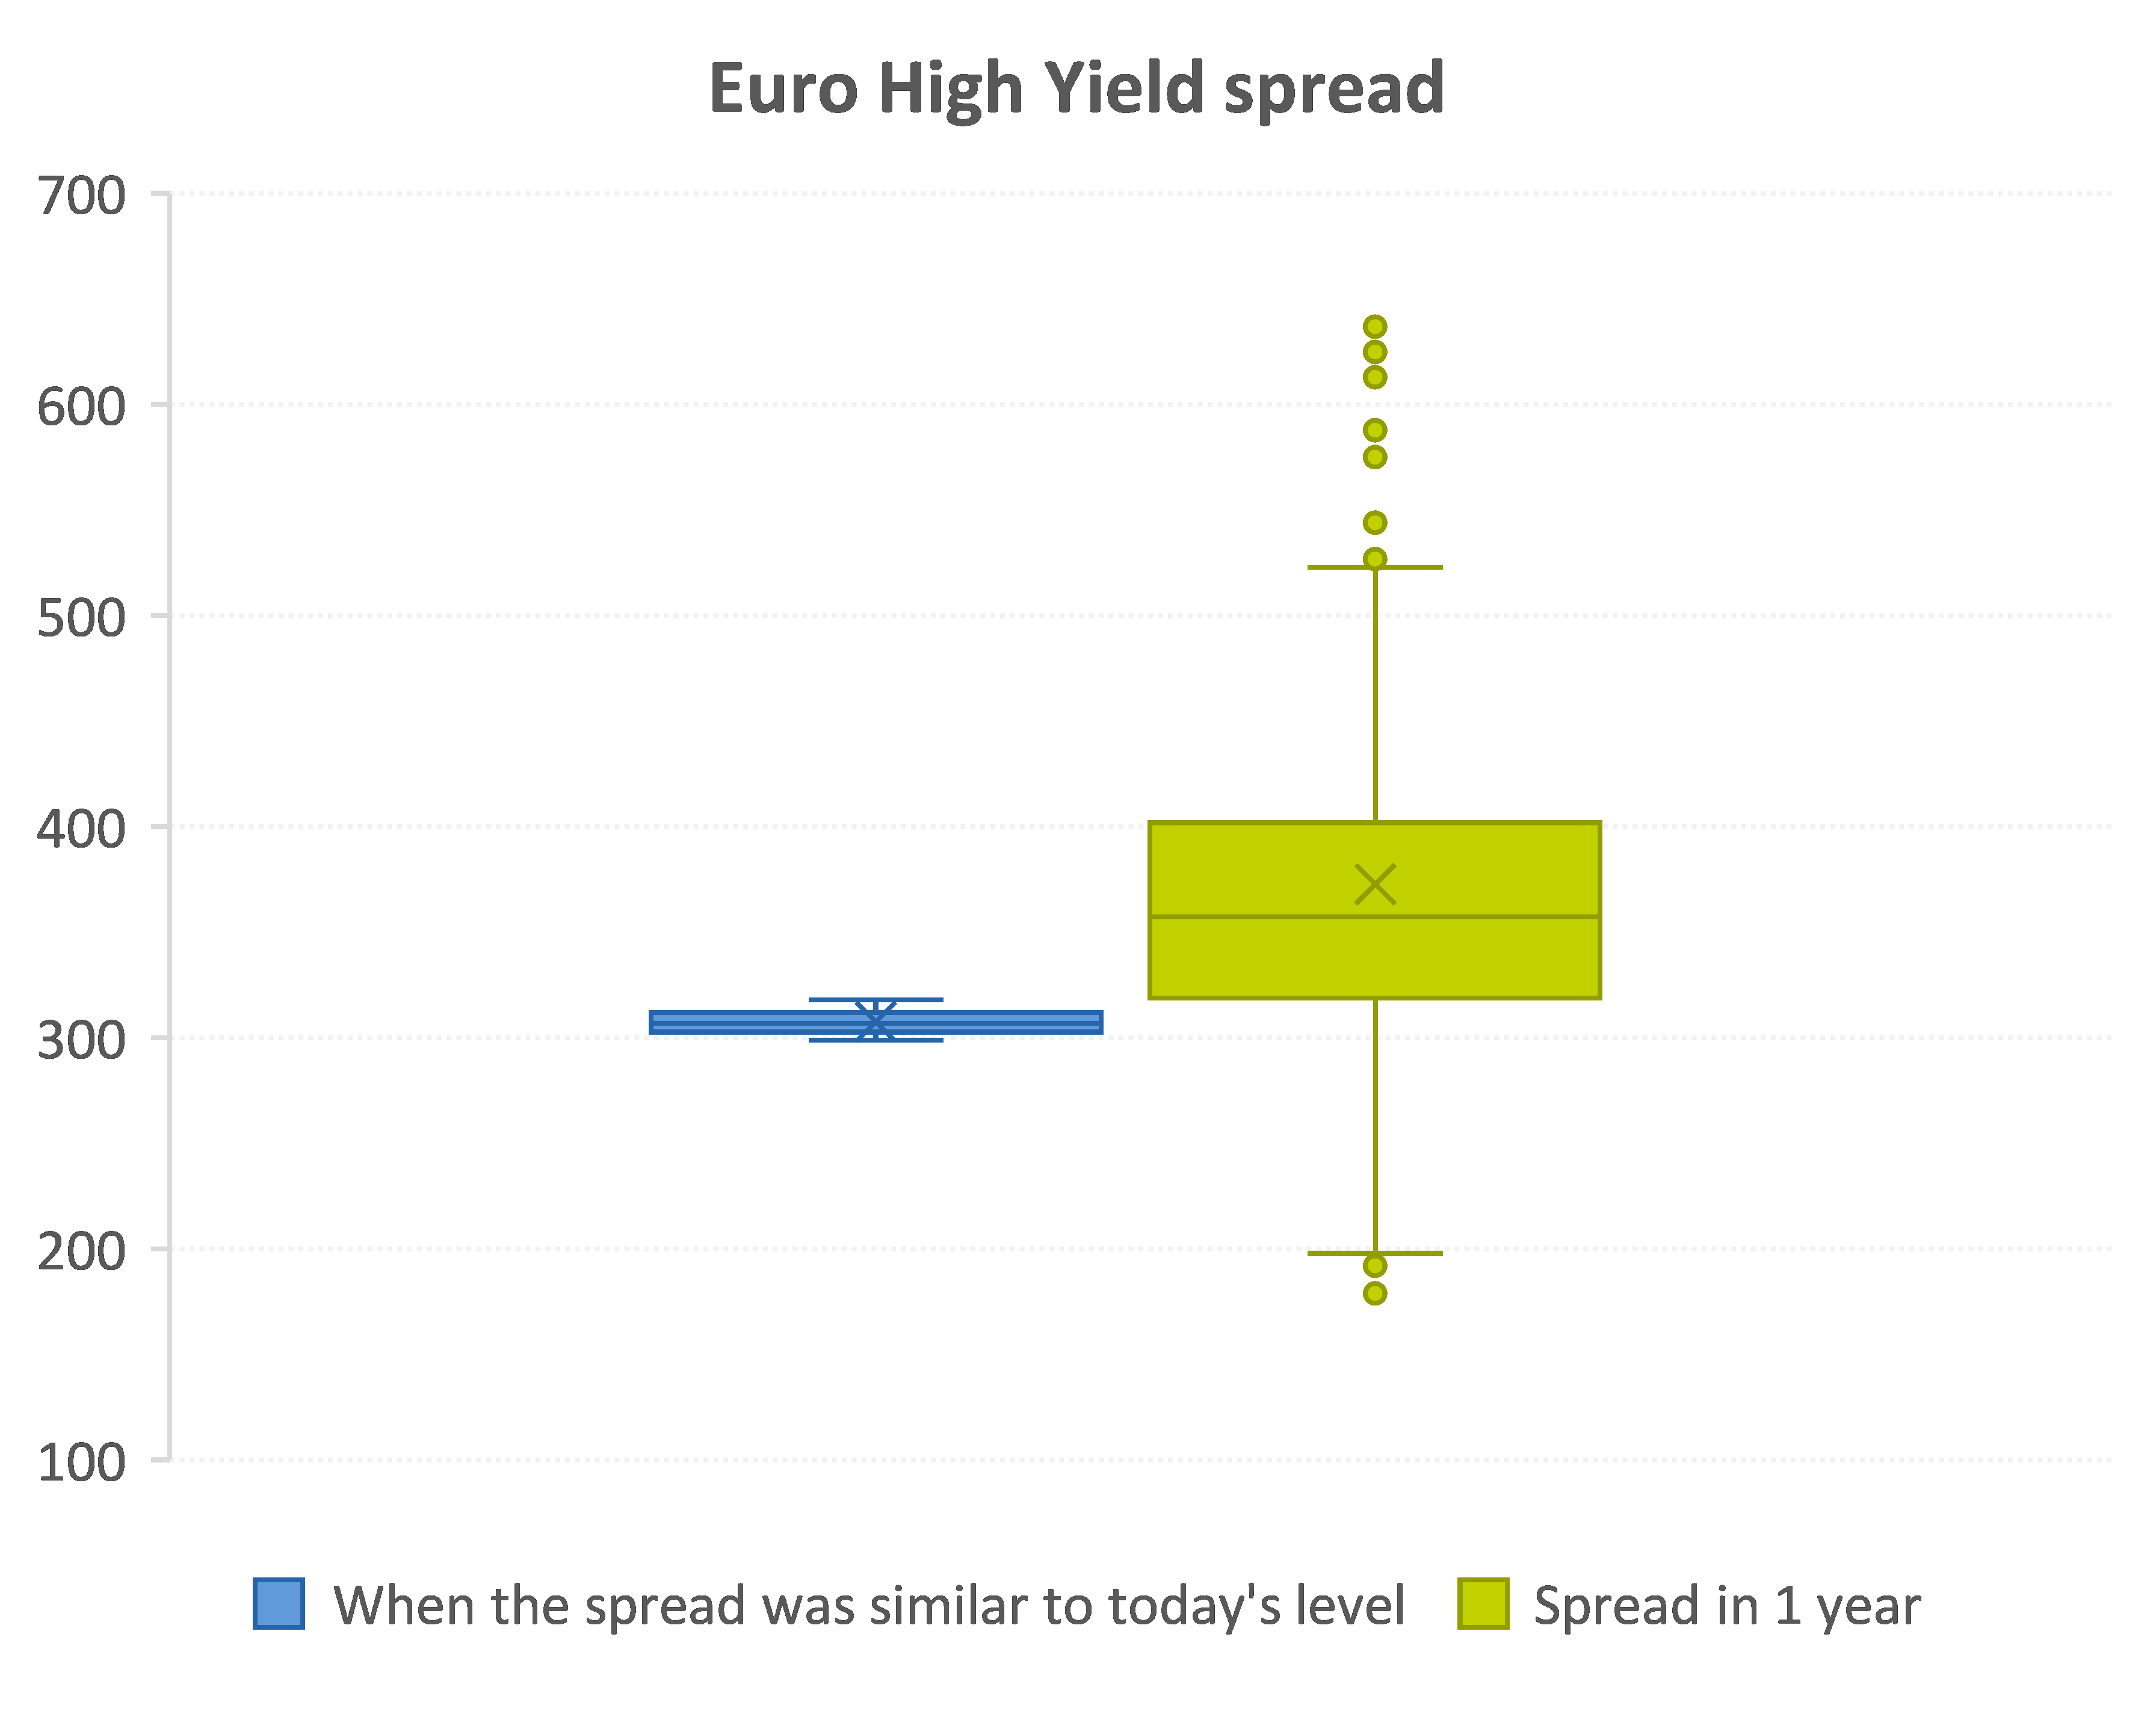
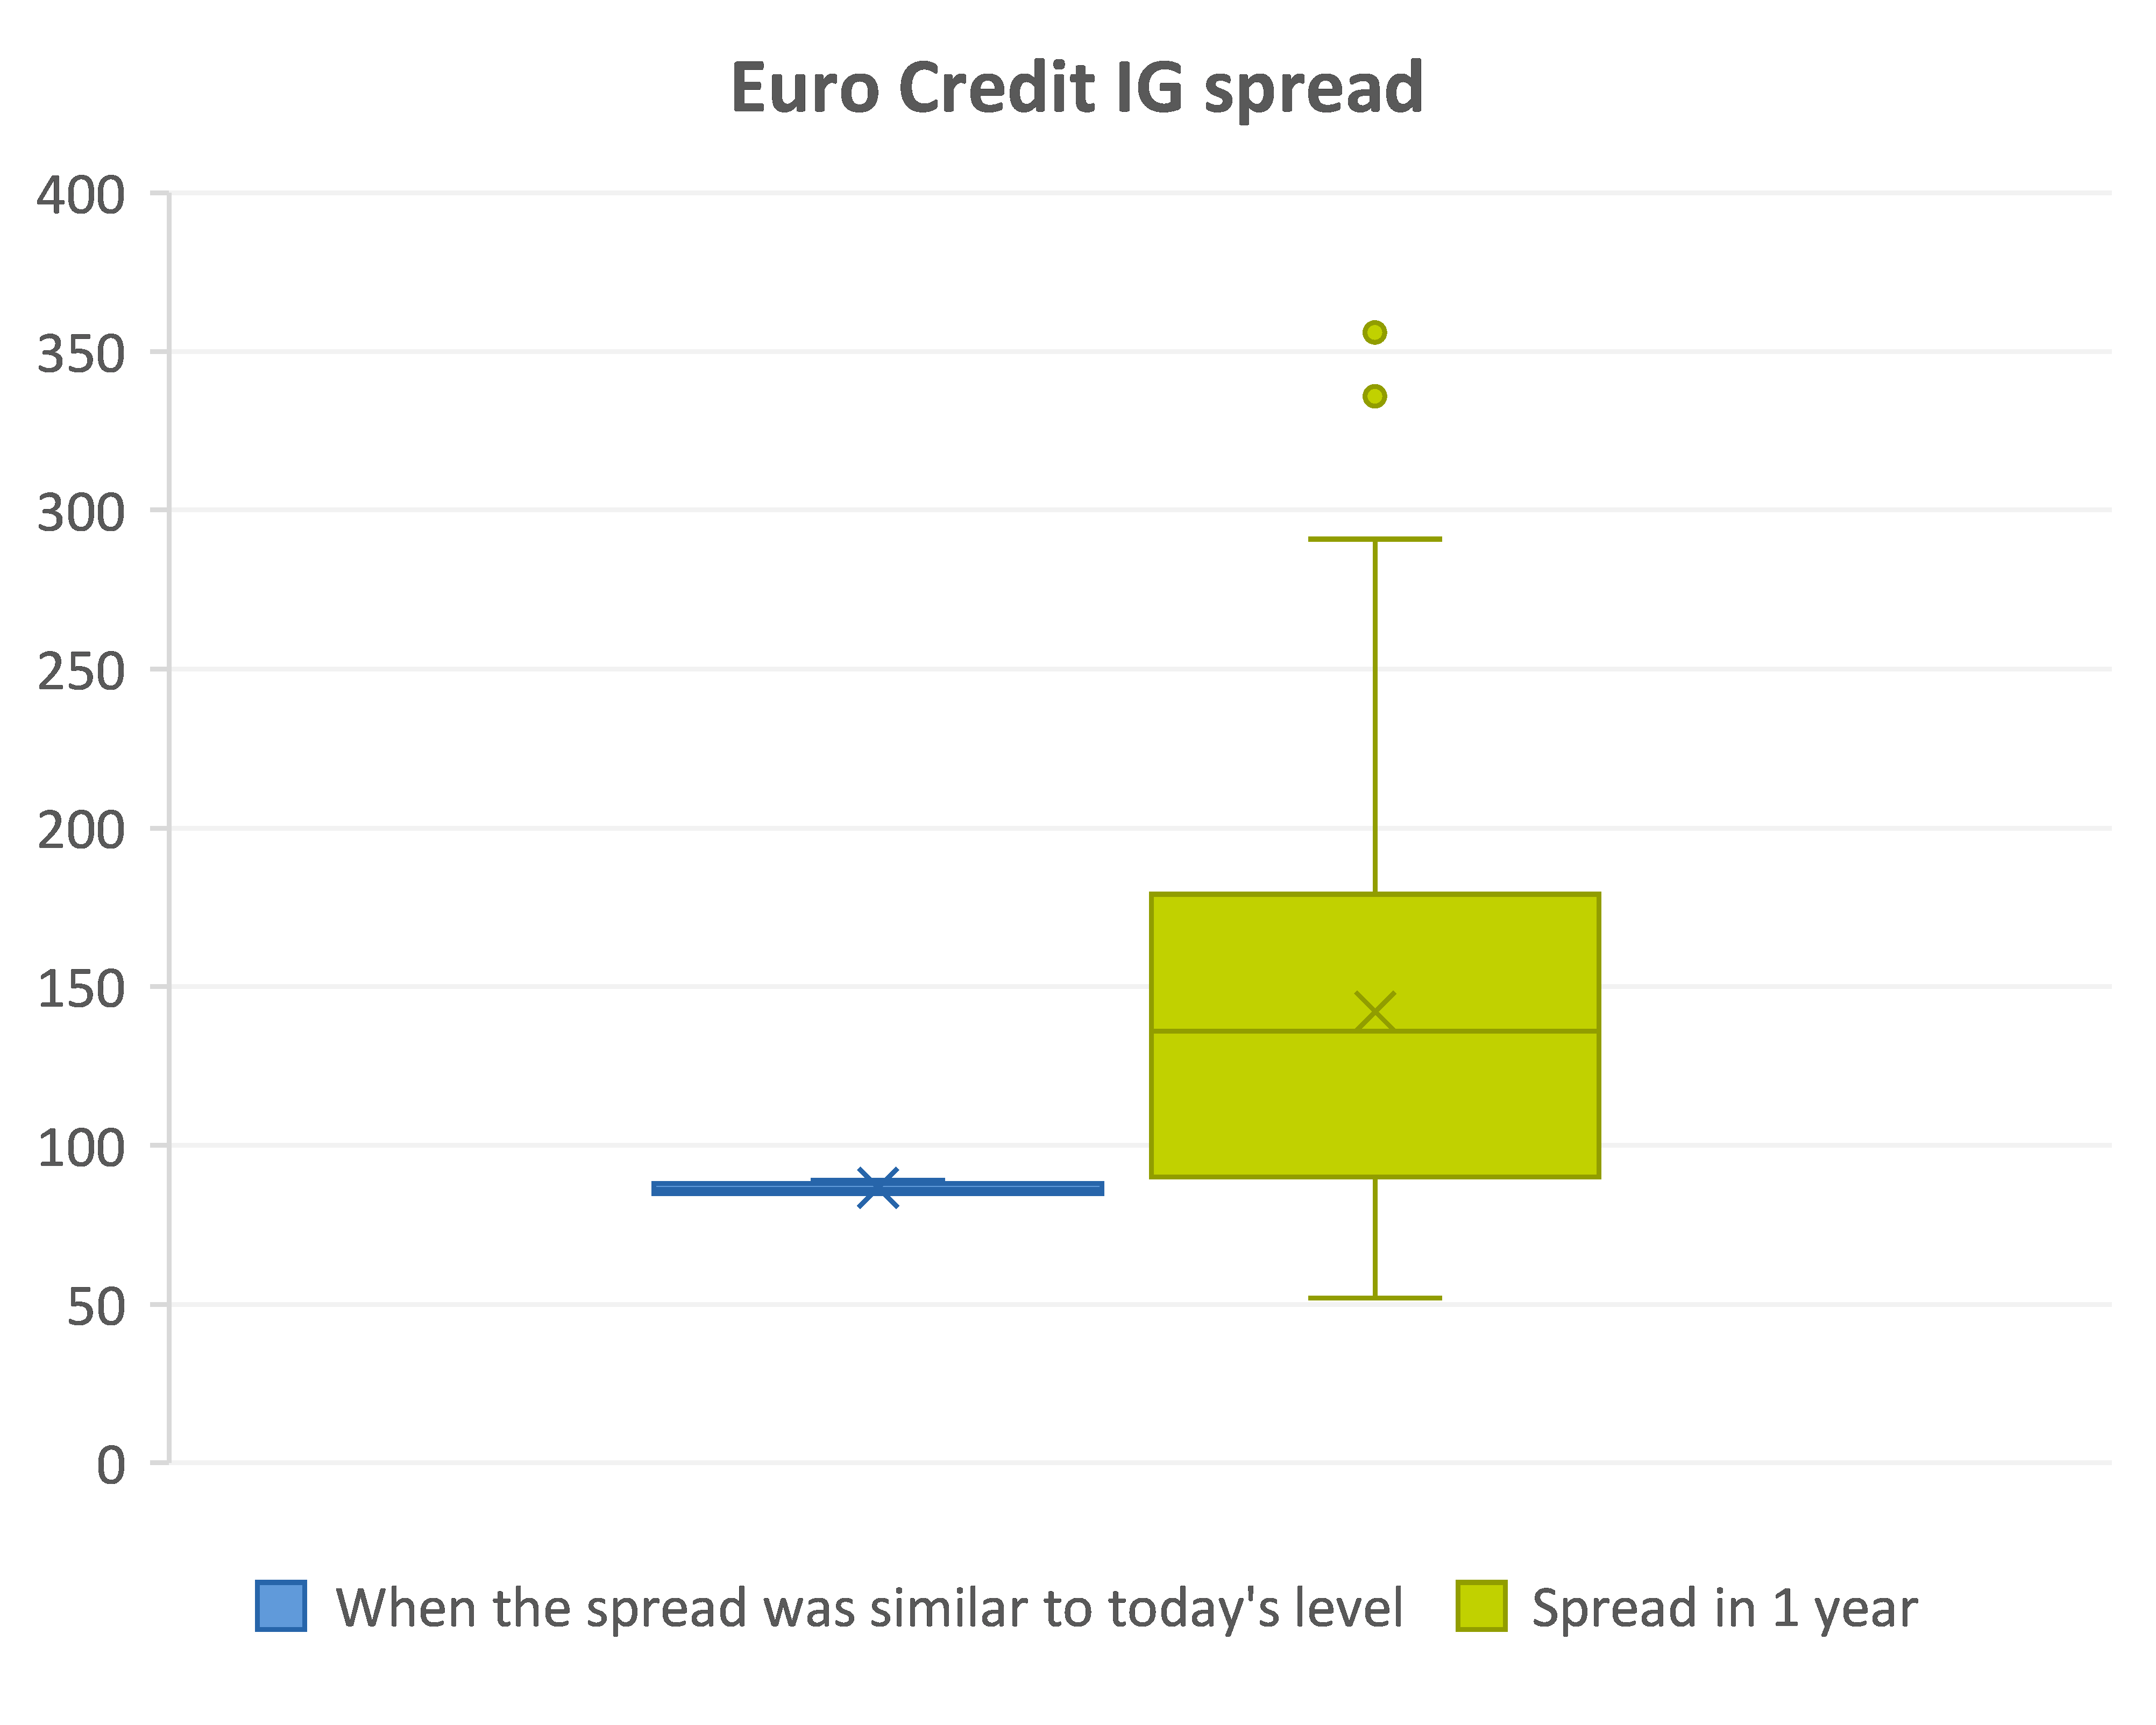
Source: ICE, AXA IM as of June 30, 2025. The backtest was conducted over the period from December 31, 1998, to June 30, 2025, using weekly data. We review historical dates when the spread was close to the current level, with a maximum difference of 20 basis points. In the boxplot, numerical data is divided into quartiles, and a box is drawn between the first and third quartiles, with a cross drawn along the second quartile to mark the median.
In total return terms, the picture appears somewhat different. Although a similar probability of spread widening is observed for both IG and HY bonds, HY tends to be more resilient thanks to the carry component (relatively high coupon income). In only 42% of cases, HY would underperform a diversified portfolio despite spread widening. In fact, the diversified portfolio begins to truly outperform HY when the HY spread widens by at least 100bp over a year.
For IG credit, where the carry component provides less cushion against spread widening, the diversified portfolio outperforms in 74% of cases.
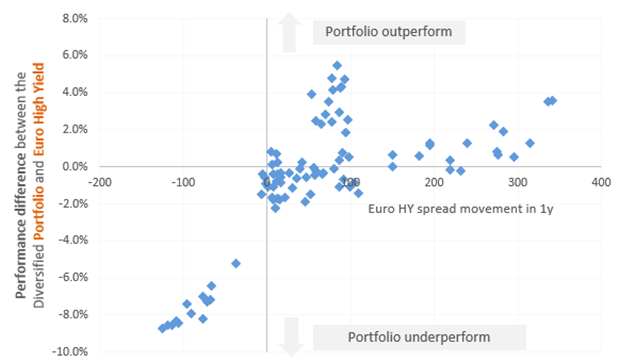
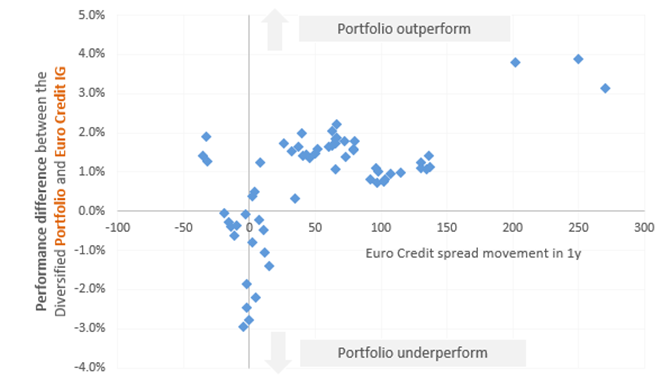
Source: ICE, AXA IM as of June 30, 2025. The backtest was conducted over the period from December 31, 1998, to June 30, 2025, using weekly data in total return terms. We review historical dates when the spread was close to the current level, with a maximum difference of 20 basis points.
The role of diversification in targeting optimal risk-adjusted returns
So why should an investor adopt a diversified approach if allocating only to HY or subordinated debt usually delivers a better return versus a diversified portfolio?
This is why focusing on risk-adjusted returns can be important, as higher returns tend to be accompanied by higher volatility and higher drawdowns.
As the chart below indicates, diversification has historically helped to significantly reduce the percentage decline in the value of a portfolio from its highest point to the subsequent lowest point before a recovery. This is known as maximum drawdown (MDD). Diversification should thus improve the risk-adjusted return of a portfolio as measured by the Sharpe ratio
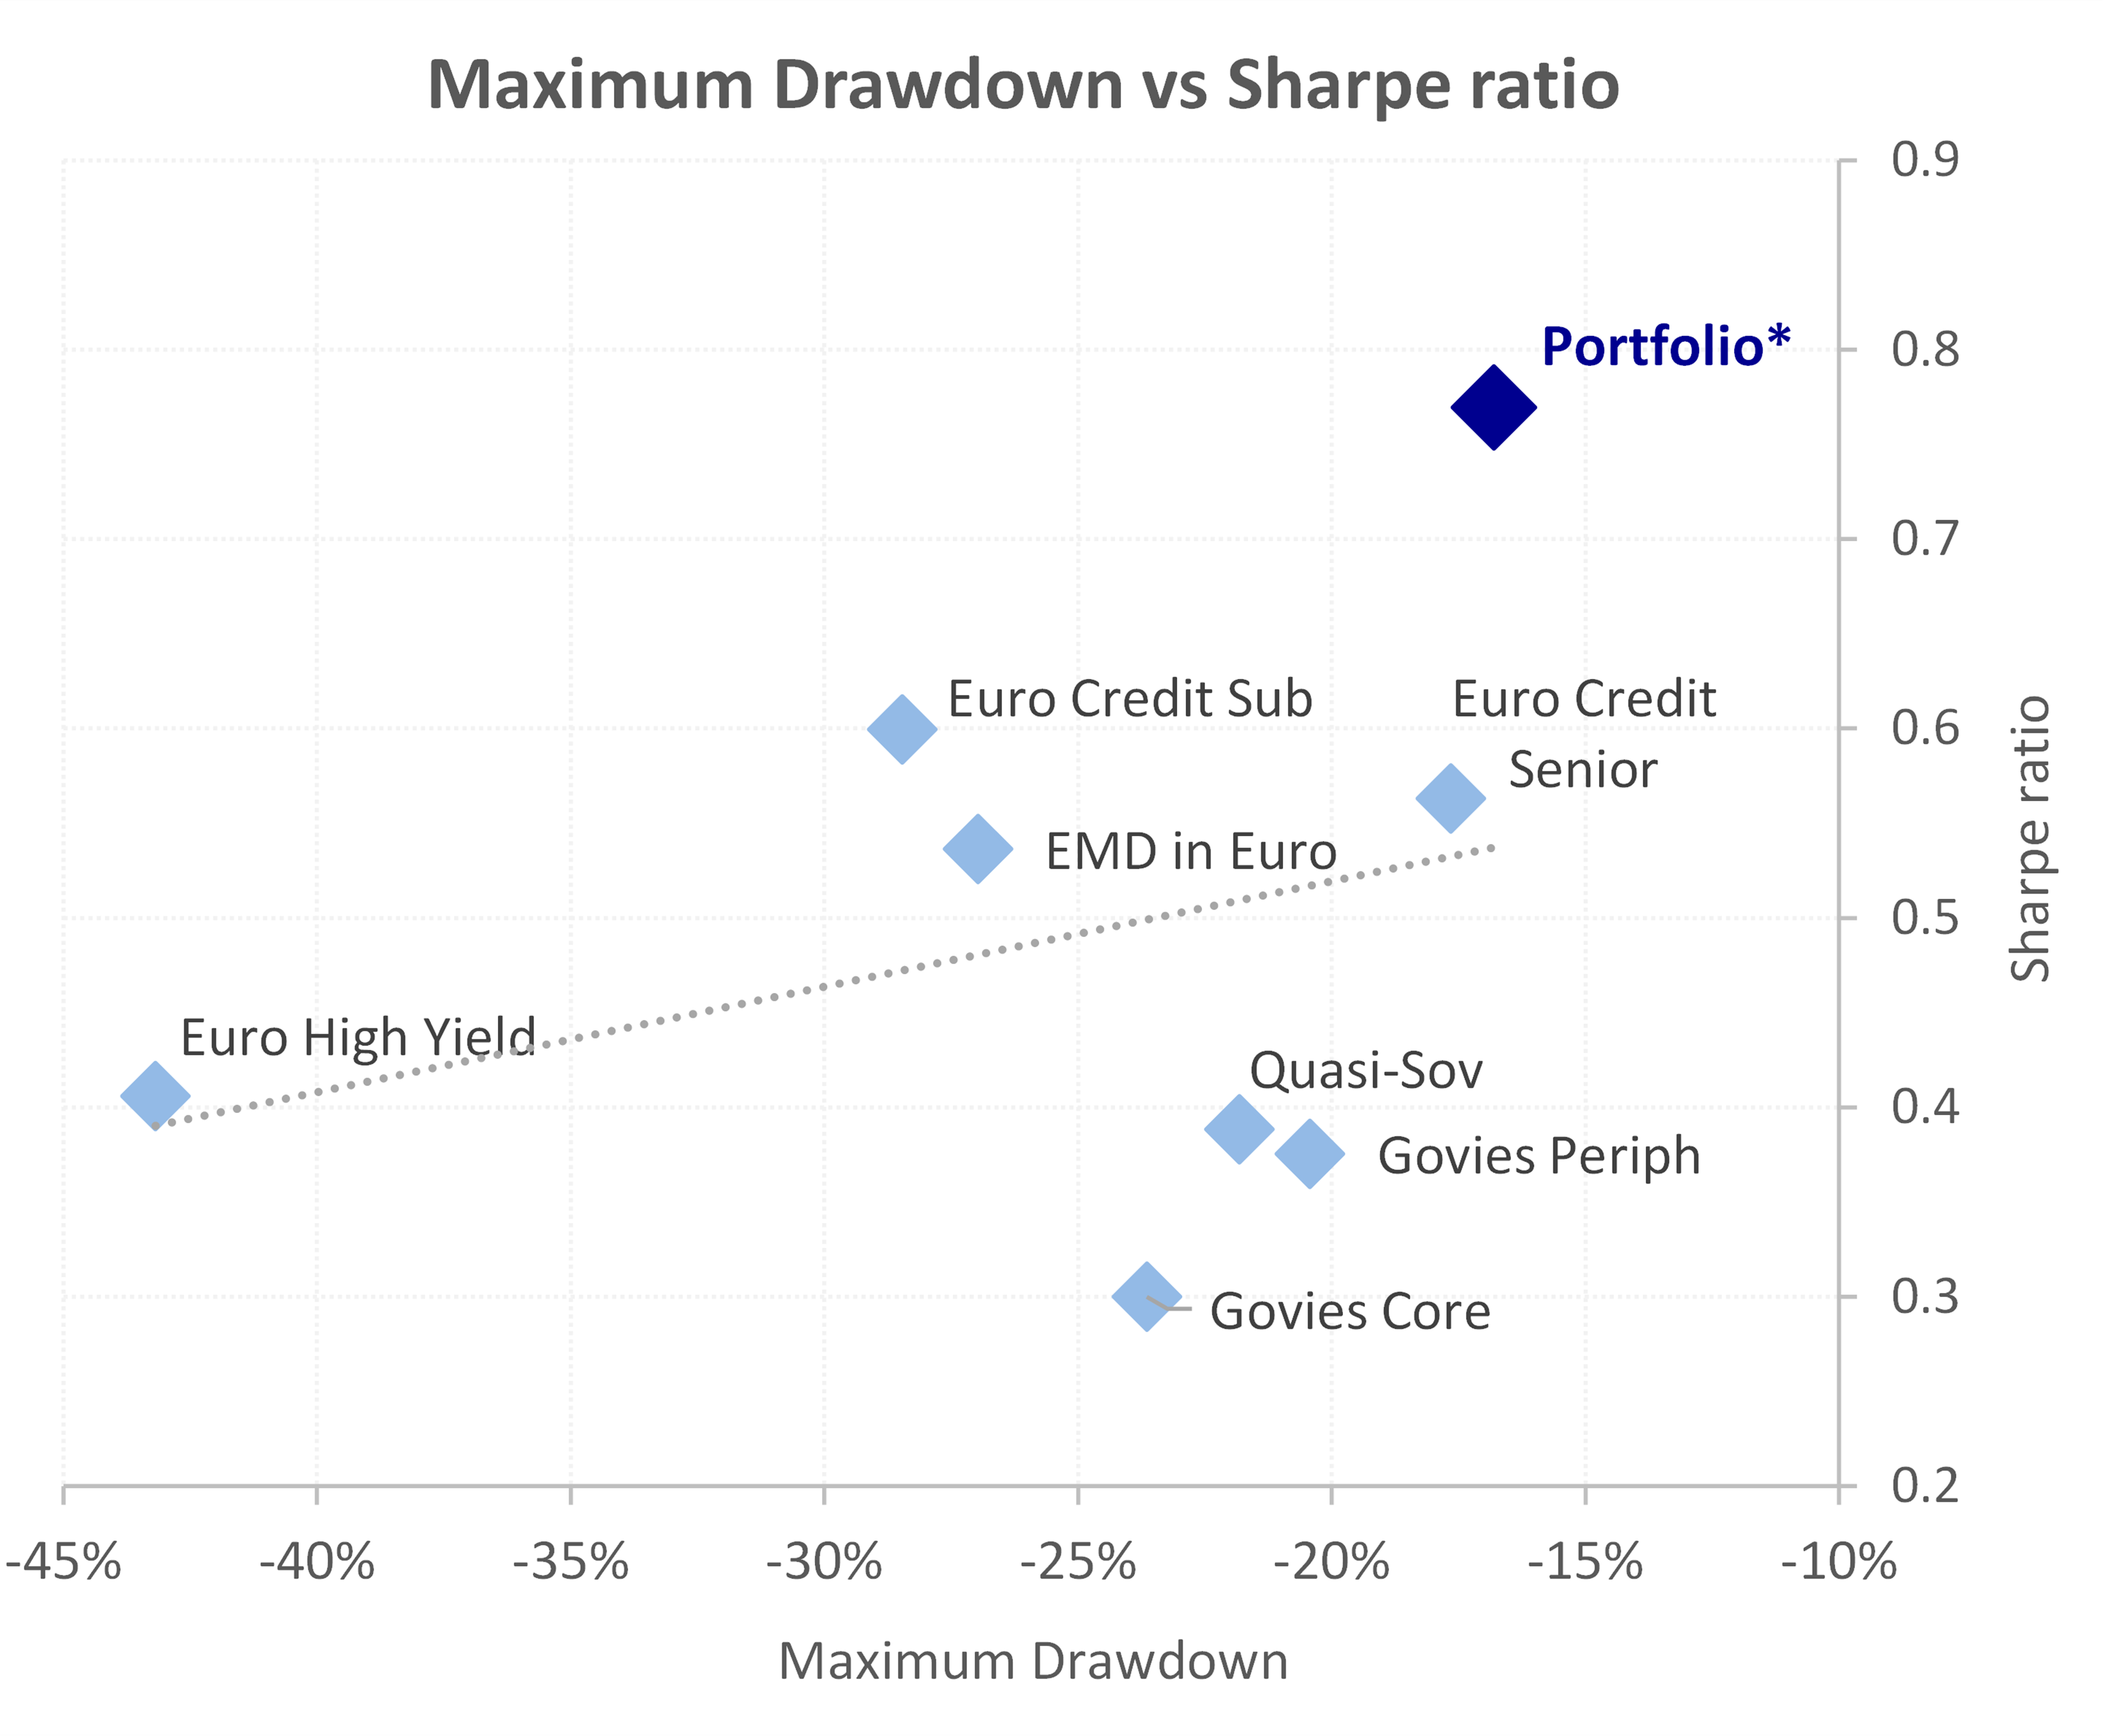
Source: ICE, AXA IM as of June 30, 2025. The backtest was conducted over the period from December 31, 1998, to June 30, 2025, using weekly data. *The diversified portfolio comprises 45% Sovereign & Quasi-Sovereign, 45% Credit, and 10% Emerging Market debt (EMD) issued in EUR.
In contrast, looking at each asset class individually, the data shows that they all have a larger MDD than the asset classes combined (demonstrated here as the Portfolio):
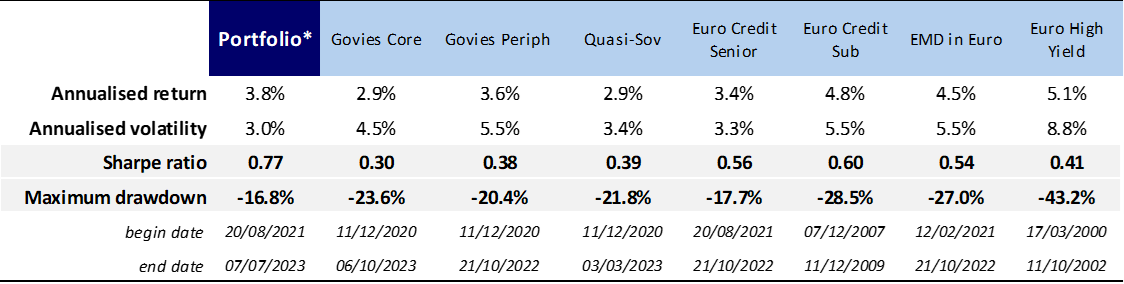
Source: AXA IM as of June 2025. For illustrative purposes only
Indeed, during previous economic crises, a diversified portfolio has consistently demonstrated greater resilience, experiencing lower drawdowns compared to single asset classes.
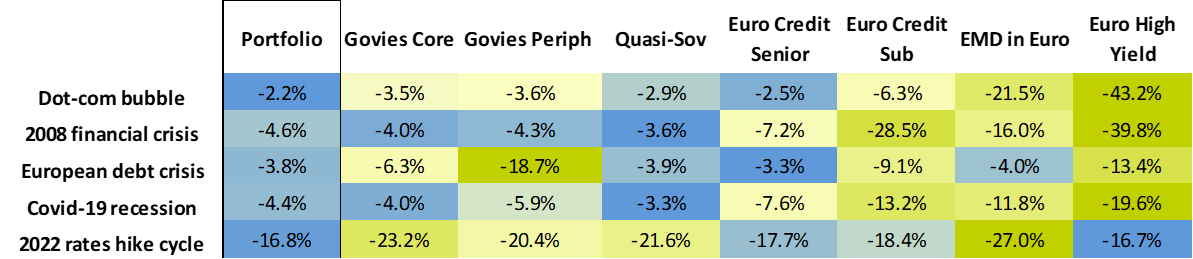
Source: ICE, AXA IM as of June 30, 2025. The backtest was conducted over the period from December 31, 1998, to June 30, 2025, using weekly data. *The diversified portfolio comprises 45% Sovereign & Quasi-Sovereign, 45% Credit, and 10% Emerging Market debt (EMD) issued in EUR. For illustrative purposes only
Significant drawdown requires time and patience to recover and may not be suitable for investors with a lower risk tolerance.
Although we recognise that a lower drawdown does not always translate into a higher SR, in the past five years’ performance, credit—especially HY—has delivered more attractive SR compared to a diversified portfolio. Clearly, the tightening of credit spreads highlighted earlier has contributed to this, along with their lower duration profile.
Why it’s important to manage duration
The importance of duration has increased in the fixed income universe compared to the period prior to the start of rate hikes by central banks four years ago. This is illustrated by the fact that duration risk now accounts for over 90% of the volatility in the Euro Aggregate universe, representing a significant source of risk, but also return.
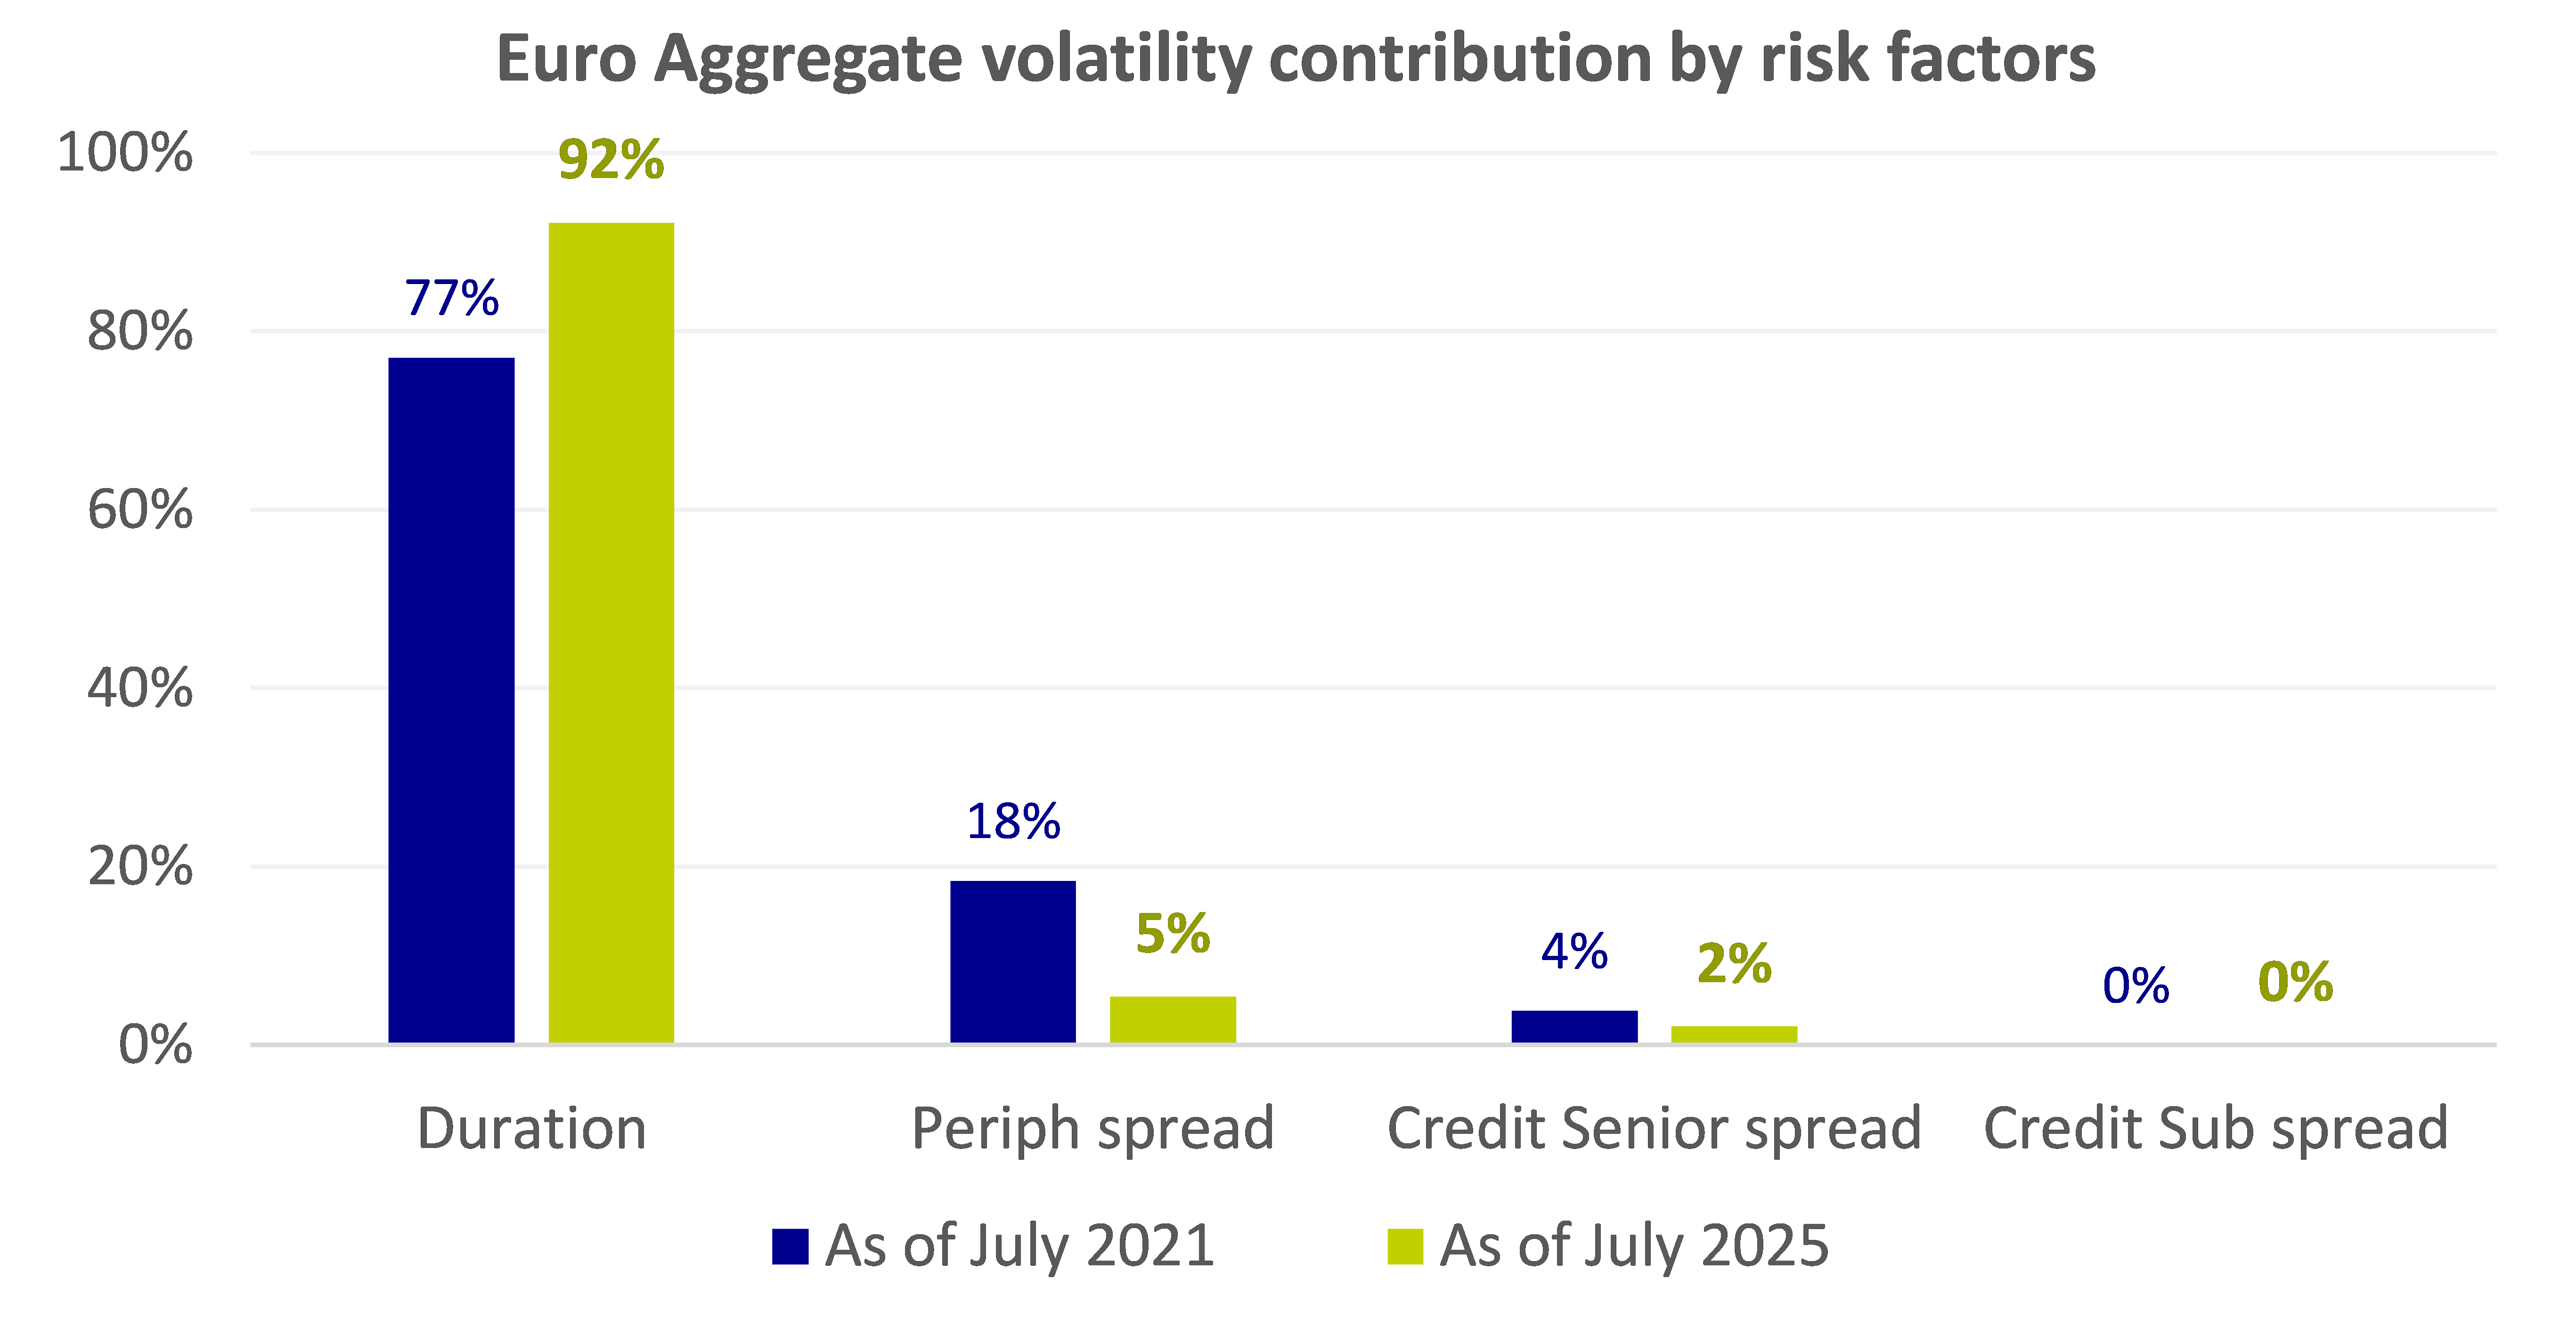
Source: ICE, AXA IM as of June 30, 2025. The risk factors are constructed to explain the source of return and volatility of asset classes, they are mutually independent to ensure that any interdependence between them has been eliminated.
As a result of the change of regime in monetary policy and an increase in rates volatility, duration is no longer a strategic asset allocation choice, but instead offers another potential lever to tactically manage a portfolio’s risk-adjusted return profile.
Despite the recent past, diversification remains key longer-term
Diversification enables a better balance among different risk factors, helping to reduce duration risk as a source of volatility and enhancing spread factors to improve the return profile. Combining diversification with flexible duration management may provide a key to success in the current fixed income environment.
Historically, diversified portfolios have delivered better SR than HY or IG portfolios and the past five years must not confuse investors.
If history is right, the chance of seeing similar tightening to what has been observed over the past five years look very unlikely. Hence, in a world of high uncertainties and tight spreads, a diversified allocation might be the appropriate fit for investors looking to allocate within fixed income. In a structurally high rates volatility environment, bringing flexible duration management to a diversified allocation may be an appealing way to deliver potentially superior long-term returns with attractive SR and limited drawdowns.


Disclaimer
The information on this website is intended for investors domiciled in Switzerland.
AXA Investment Managers Switzerland Ltd (Part of BNP Paribas Group) is not liable for unauthorised use of the website.
This website is for advertising and informational purpose only. The published information and expression of opinions are provided for personal use only. The information, data, figures, opinions, statements, analyses, forecasts, simulations, concepts and other data provided by AXA Investment Managers Switzerland Ltd (Part of BNP Paribas Group) in this document are based on our knowledge and experience at the time of preparation and are subject to change without notice.
AXA Investment Managers Switzerland Ltd (Part of BNP Paribas Group) excludes any warranty (explicit or implicit) for the accuracy, completeness and up-to-dateness of the published information and expressions of opinion. In particular, AXA Investment Managers Switzerland Ltd (Part of BNP Paribas Group) is not obliged to remove information that is no longer up to date or to expressly mark it a such. To the extent that the data contained in this document originates from third parties, AXA Investment Managers Switzerland Ltd (Part of BNP Paribas Group) is not responsible for the accuracy, completeness, up-to-dateness and appropriateness of such data, even if only such data is used that is deemed to be reliable.
The information on the website of AXA Investment Managers Switzerland Ltd (Part of BNP Paribas Group) does not constitute a decision aid for economic, legal, tax or other advisory questions, nor may investment or other decisions be made solely on the basis of this information. Before any investment decision is made, detailed advice should be obtained that is geared to the client's situation.
Past performance or returns are neither a guarantee nor an indicator of the future performance or investment returns. The value and return on an investment is not guaranteed. It can rise and fall and investors may even incur a total loss.
AXA Investment Managers Switzerland Ltd (Part of BNP Paribas Group)
__________________________________________________________________________
AXA IM and BNPP AM are progressively merging and streamlining our legal entities to create a unified structure
AXA Investment Managers joined BNP Paribas Group in July 2025. Following the merger of AXA Investment Managers Paris and BNP PARIBAS ASSET MANAGEMENT Europe and their respective holding companies on December 31, 2025, the combined company now operates under the BNP PARIBAS ASSET MANAGEMENT Europe name.