
How liquid is the green bond market?
- 16 January 2023 (5 min read)
Key points:
- The existence of the ‘greenium’ in the green bond market raises the question of whether this phenomenon also affects liquidity in the sector
- We have tested this suggestion by closely comparing the characteristics of the green and conventional bond markets using bid-ask spreads and Bloomberg liquidity scores
- The findings suggest that despite a clear difference in tradeable volumes across the two segments, the euro green bond segment shows an equivalent bid-ask spread for a lower liquidity score
The green bond sector has grown to be a $1trn-plus investable market that has seen a sharp uptick in diversification on the credit side and an increasing number of sovereign issuers.1
It is evolving as a mature sector, with granularity and depth, but this hasn’t robbed it of idiosyncrasies. Most prominent is perhaps the so-called ‘greenium’ – the idea that excess demand can drive lower yields.
We have explored this issue before and found that the greenium is, in fact, an uneven and perhaps exploitable phenomenon for active investors. But it does raise another question: Do those potential supply-demand imbalances mean there may be liquidity issues in green bonds compared to the conventional bond market?
Digging into the liquidity profiles of the two markets, we found that both trade with a similar difference between the highest someone is willing to pay and the lowest a seller is willing to accept (the bid-ask spread), with slightly lower volumes in green bonds.2 But there is more to the story than that.
To compare the liquidity of the green and conventional universes, we have focused on two dimensions: The average bid-ask spread observed on each security; and the Bloomberg liquidity score. The Bloomberg Liquidity Assessment (which runs low-to-high from 1-100 and is known as LQA) aims to quantify and compare the liquidity of securities based on their respective trading cost for a comparable range of volumes.3 We will look at both metrics through different breakdowns (currency or sector level) and from both a weighted and unweighted perspective so that we can even out any differences in segment exposure.
Comparing universes
To examine the segments, we used the ICE BofA Green Bond Index (GREN) and ICE BofA Global Broad Market Index (GBMI) and focused on the euro and US dollar as the most representative of the green bond universe. We also excluded securitised debt which is rare in the green bond universe, and ignored market weights.
We observe that the weighted average bid-ask spread of green bonds looks smaller than that of conventional bonds (Figure 1). The conclusion is the same when rebalancing euro and dollar in both universes (unweighted average at 0.30% versus 0.34%). Yet the liquidity score (Figure 2), that takes into account tradeable volumes, provides a valuable insight as it looks similar for both green and conventional bonds (weighted or unweighted average around 48). One could assume that this means green bonds do not bear any additional transaction cost but exhibit lower transaction volumes than conventional bonds.4
- U291cmNlOiBBWEEgSU0vQmxvb21iZXJn
- QmlkLWFzayBzcHJlYWRzIGFyZSB1c2VkIGFzIGEgbWVhc3VyZSBvZiBsaXF1aWRpdHkgYXMgdGhleSBkZXNjcmliZSB0aGUgZGlmZmVyZW5jZSBiZXR3ZWVuIHRoZSBwcmljZSBzb21lb25lIGlzIHdpbGxpbmcgdG8gcGF5IGFuZCB0aGUgcHJpY2Ugc29tZW9uZSBpcyB3aWxsaW5nIHRvIGFjY2VwdCBmb3IgYSBzZWN1cml0eS4gSXQgaXMgZ2VuZXJhbGx5IGNvbnNpZGVyZWQgdGhhdCB0aGUgbmFycm93ZXIgdGhhdCBnYXAsIHRoZW4gdGhlIGdyZWF0ZXIgdGhlIGxpa2VsaWhvb2Qgb2YgYSBtb3JlIGxpcXVpZCBtYXJrZXQu
- Qmxvb21iZXJnIExpcXVpZGl0eSBBc3Nlc3NtZW50OiBCbG9vbWJlcmcgUHJvZmVzc2lvbmFsIFNlcnZpY2VzLCByZXRyaWV2ZWQgTm92ZW1iZXIgMjAyMg==
- UGFzdCBwZXJmb3JtYW5jZSBpcyBub3QgYSByZWxpYWJsZSBpbmRpY2F0b3Igb2YgZnV0dXJlIHJlc3VsdHMuIFRoZSB2YWx1ZSBvZiBpbnZlc3RtZW50cyBtYXkgZmFsbCBhcyB3ZWxsIGFzIHJpc2UgYW5kIHlvdSBtYXkgbm90IGdldCBiYWNrIHRoZSBmdWxsIGFtb3VudCBpbnZlc3RlZC4=
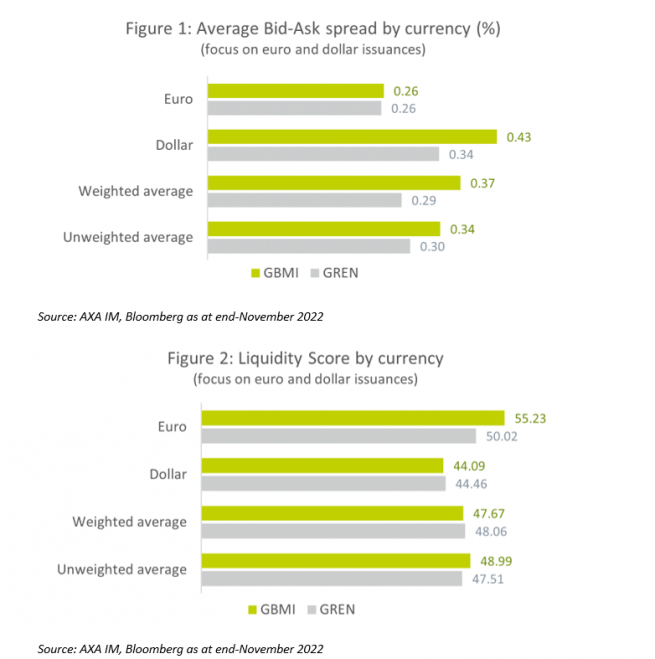
But it is already interesting to see that the euro segment, the one offering more granularity, tells us a slightly different story with a comparable bid-ask spread and a lower liquidity score.
The green bond universe is dominated by euro-denominated debt, mostly corporate and quasi-sovereign, while the conventional universe is dominated by dollar issuance, mostly by sovereigns. Hence, we think a more reliable approach would be to correct both universes’ biases in order to have a more accurate comparison basis.
Rebalancing for sector biases
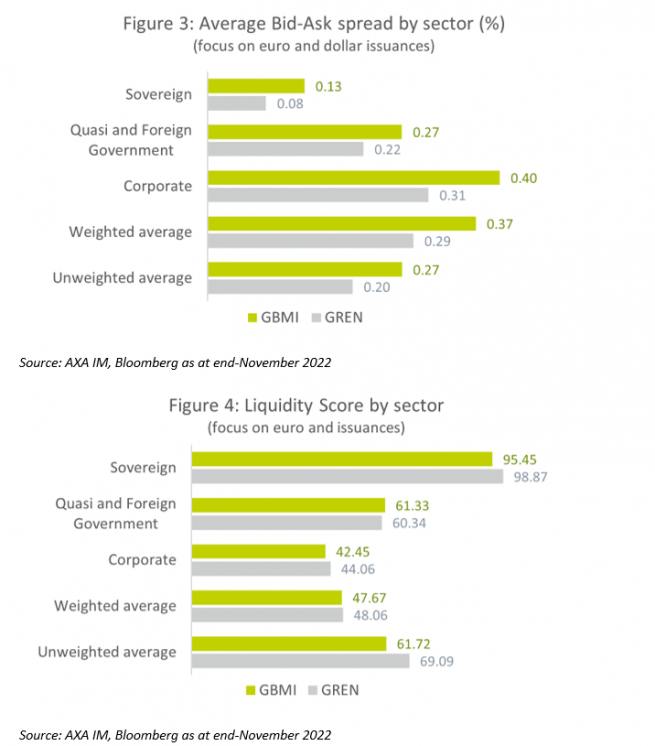
Looking at the sectoral breakdown for both universes (Figure 3 and 4), it is no surprise to see that the most liquid segment that also exhibits the smaller bid-ask spread is the sovereign segment. Yet it is interesting to note that in every segment, green bonds again show a smaller bid-ask spread for comparable or higher liquidity scores than conventional bonds. Hence, rebalancing sectors across both universes actually shows an even more favourable picture of the green bond universe with lower bid-ask spread and higher liquidity score (unweighted average at 69.1 versus 61.7).
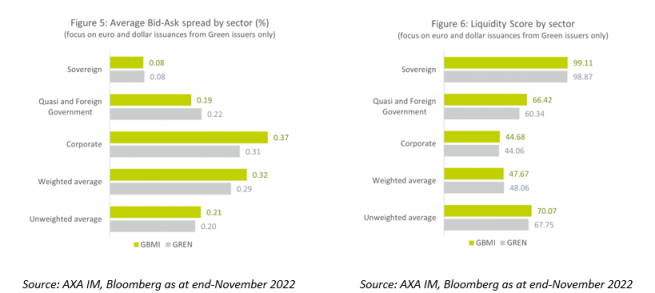
Despite the growth of the green bond universe over the recent past and the arrival of inaugural issuers joining the market every year (circa 100 in 2022), there is still a significant difference in the number of active issuers compared to the conventional universe. In our view then, the cleanest approach to properly compare green and conventional bonds is to focus exclusively on issuers that have already issued at least one green bond.
This additional filter particularly benefits the conventional bond universe. Indeed, the average bid-ask spread is significantly reduced (Figure 5, unweighted average bid-ask spread at 0.20 versus 0.21) and converges towards the average bid-ask spread observed for green bonds. This seems relatively consistent with the fact that we are now looking at the same issuers across both universes and ignoring weighting differences. In the meantime, the liquidity score is boosted above that of the green bond universe. This is certainly consistent with the fact that outstanding conventional debt is at a higher level than the outstanding green debt.
Green bond liquidity is not an issue
This final picture brings us back to our initial observation of the euro green bond segment that showcased an equivalent bid-ask spread for a lower liquidity score. Furthermore, there are several insights to draw.
First, euro issuance is a very accurate proxy for the universe and can provide a good picture of what to potentially expect in terms of market dynamics and liquidity for other currencies as the green bond sector progressively expands. Second, green bond issuers tend to be more liquid than non-green issuers.
Finally, at issuance level there is no additional transaction cost of trading green bonds compared to conventional bonds and yet daily tradable volumes remain lower. Strong primary market activity – at close to $400bn for the second year in a row in 2022 despite a very challenging 12 months – suggests to us that this issue of tradeable volumes may well be progressively dissipated.5
- U291cmNlOiBBWEEgSU0sIEJsb29tYmVyZyBhcyBvZiBlbmQtMjAyMg==
Disclaimer
The information on this website is intended for investors domiciled in Switzerland.
AXA Investment Managers Switzerland Ltd (AXA IM) is not liable for unauthorised use of the website.
This website is for advertising and informational purpose only. The published information and expression of opinions are provided for personal use only. The information, data, figures, opinions, statements, analyses, forecasts, simulations, concepts and other data provided by AXA IM in this document are based on our knowledge and experience at the time of preparation and are subject to change without notice.
AXA IM excludes any warranty (explicit or implicit) for the accuracy, completeness and up-to-dateness of the published information and expressions of opinion. In particular, AXA IM is not obliged to remove information that is no longer up to date or to expressly mark it a such. To the extent that the data contained in this document originates from third parties, AXA IM is not responsible for the accuracy, completeness, up-to-dateness and appropriateness of such data, even if only such data is used that is deemed to be reliable.
The information on the website of AXA IM does not constitute a decision aid for economic, legal, tax or other advisory questions, nor may investment or other decisions be made solely on the basis of this information. Before any investment decision is made, detailed advice should be obtained that is geared to the client's situation.
Past performance or returns are neither a guarantee nor an indicator of the future performance or investment returns. The value and return on an investment is not guaranteed. It can rise and fall and investors may even incur a total loss.
AXA Investment Managers Switzerland Ltd.