
How to consider a B/BB US high yield strategy within a portfolio
- 05 December 2023 (7 min read)
Key points:
- For investors who wish to exclude CCC and below rated assets, but still want to include high yield exposure in their asset allocation, a B/BB approach may offer a compelling solution.
- With an attractive long-term risk/return profile compared to the broad US high yield and investment grade markets, there are different ways that a B/BB strategy can be positioned in a portfolio.
- Today, there is a strong valuation argument for a B/BB strategy, with yields that capture most of the broad US high yield market yield and higher quality bonds priced at a significant discount to par.
The US high yield market has performed well in 2023, offering investors attractive all-in yields and a healthy fundamental backdrop during a year that has been marred with uncertainty and surprises. Many high yield companies came into 2023 having taken advantage of cheap borrowing costs from previous years. They have, therefore, largely been able to weather the rising rates environment without needing to refinance. In many cases they have also used free cash flow to pay down debt and de-lever. This can be seen by the fact that both high yield leverage and coverage ratios are coming off historically strong levels, albeit starting to deteriorate towards the end of 2023 as the ‘higher for longer’ interest rate environment drives dispersion higher. This is particularly seen amongst more levered, capital-intensive companies that do not have the cashflow to absorb significant interest rate increases.
Although this increasing dispersion is leading to a pick-up in default activity, driven particularly by a larger proportion of distressed exchanges and borrowers who also have a loan component in their capital structure which is more immediately impacted from higher rates, we continue to believe that corporate fundamentals remain robust enough to prevent the default rate of the US high yield bond market from increasing to a level significantly higher than its long-term average (3.3% according to JP Morgan).
In this environment, we think that a higher quality high yield strategy offers compelling opportunities to investors who are seeking a yield pick-up from investment grade but remain concerned about the macro environment and want to avoid the part of the high yield market which has historically carried the most default risk. Based on our outlook for the economy and current valuations, we believe that this portion of the US high yield market can deliver attractive total returns over the next 12 months and beyond.
Understanding the high yield credit spectrum
For some investors, accessing the full spectrum of the high yield market is not possible due to capital risk or regulatory requirements. For others, it may be possible, but concerns around default rates may dictate a preference for a higher quality approach. An option for such investors may be to take a more selective approach to high yield and invest via a B/BB strategy rather than avoid high yield altogether.
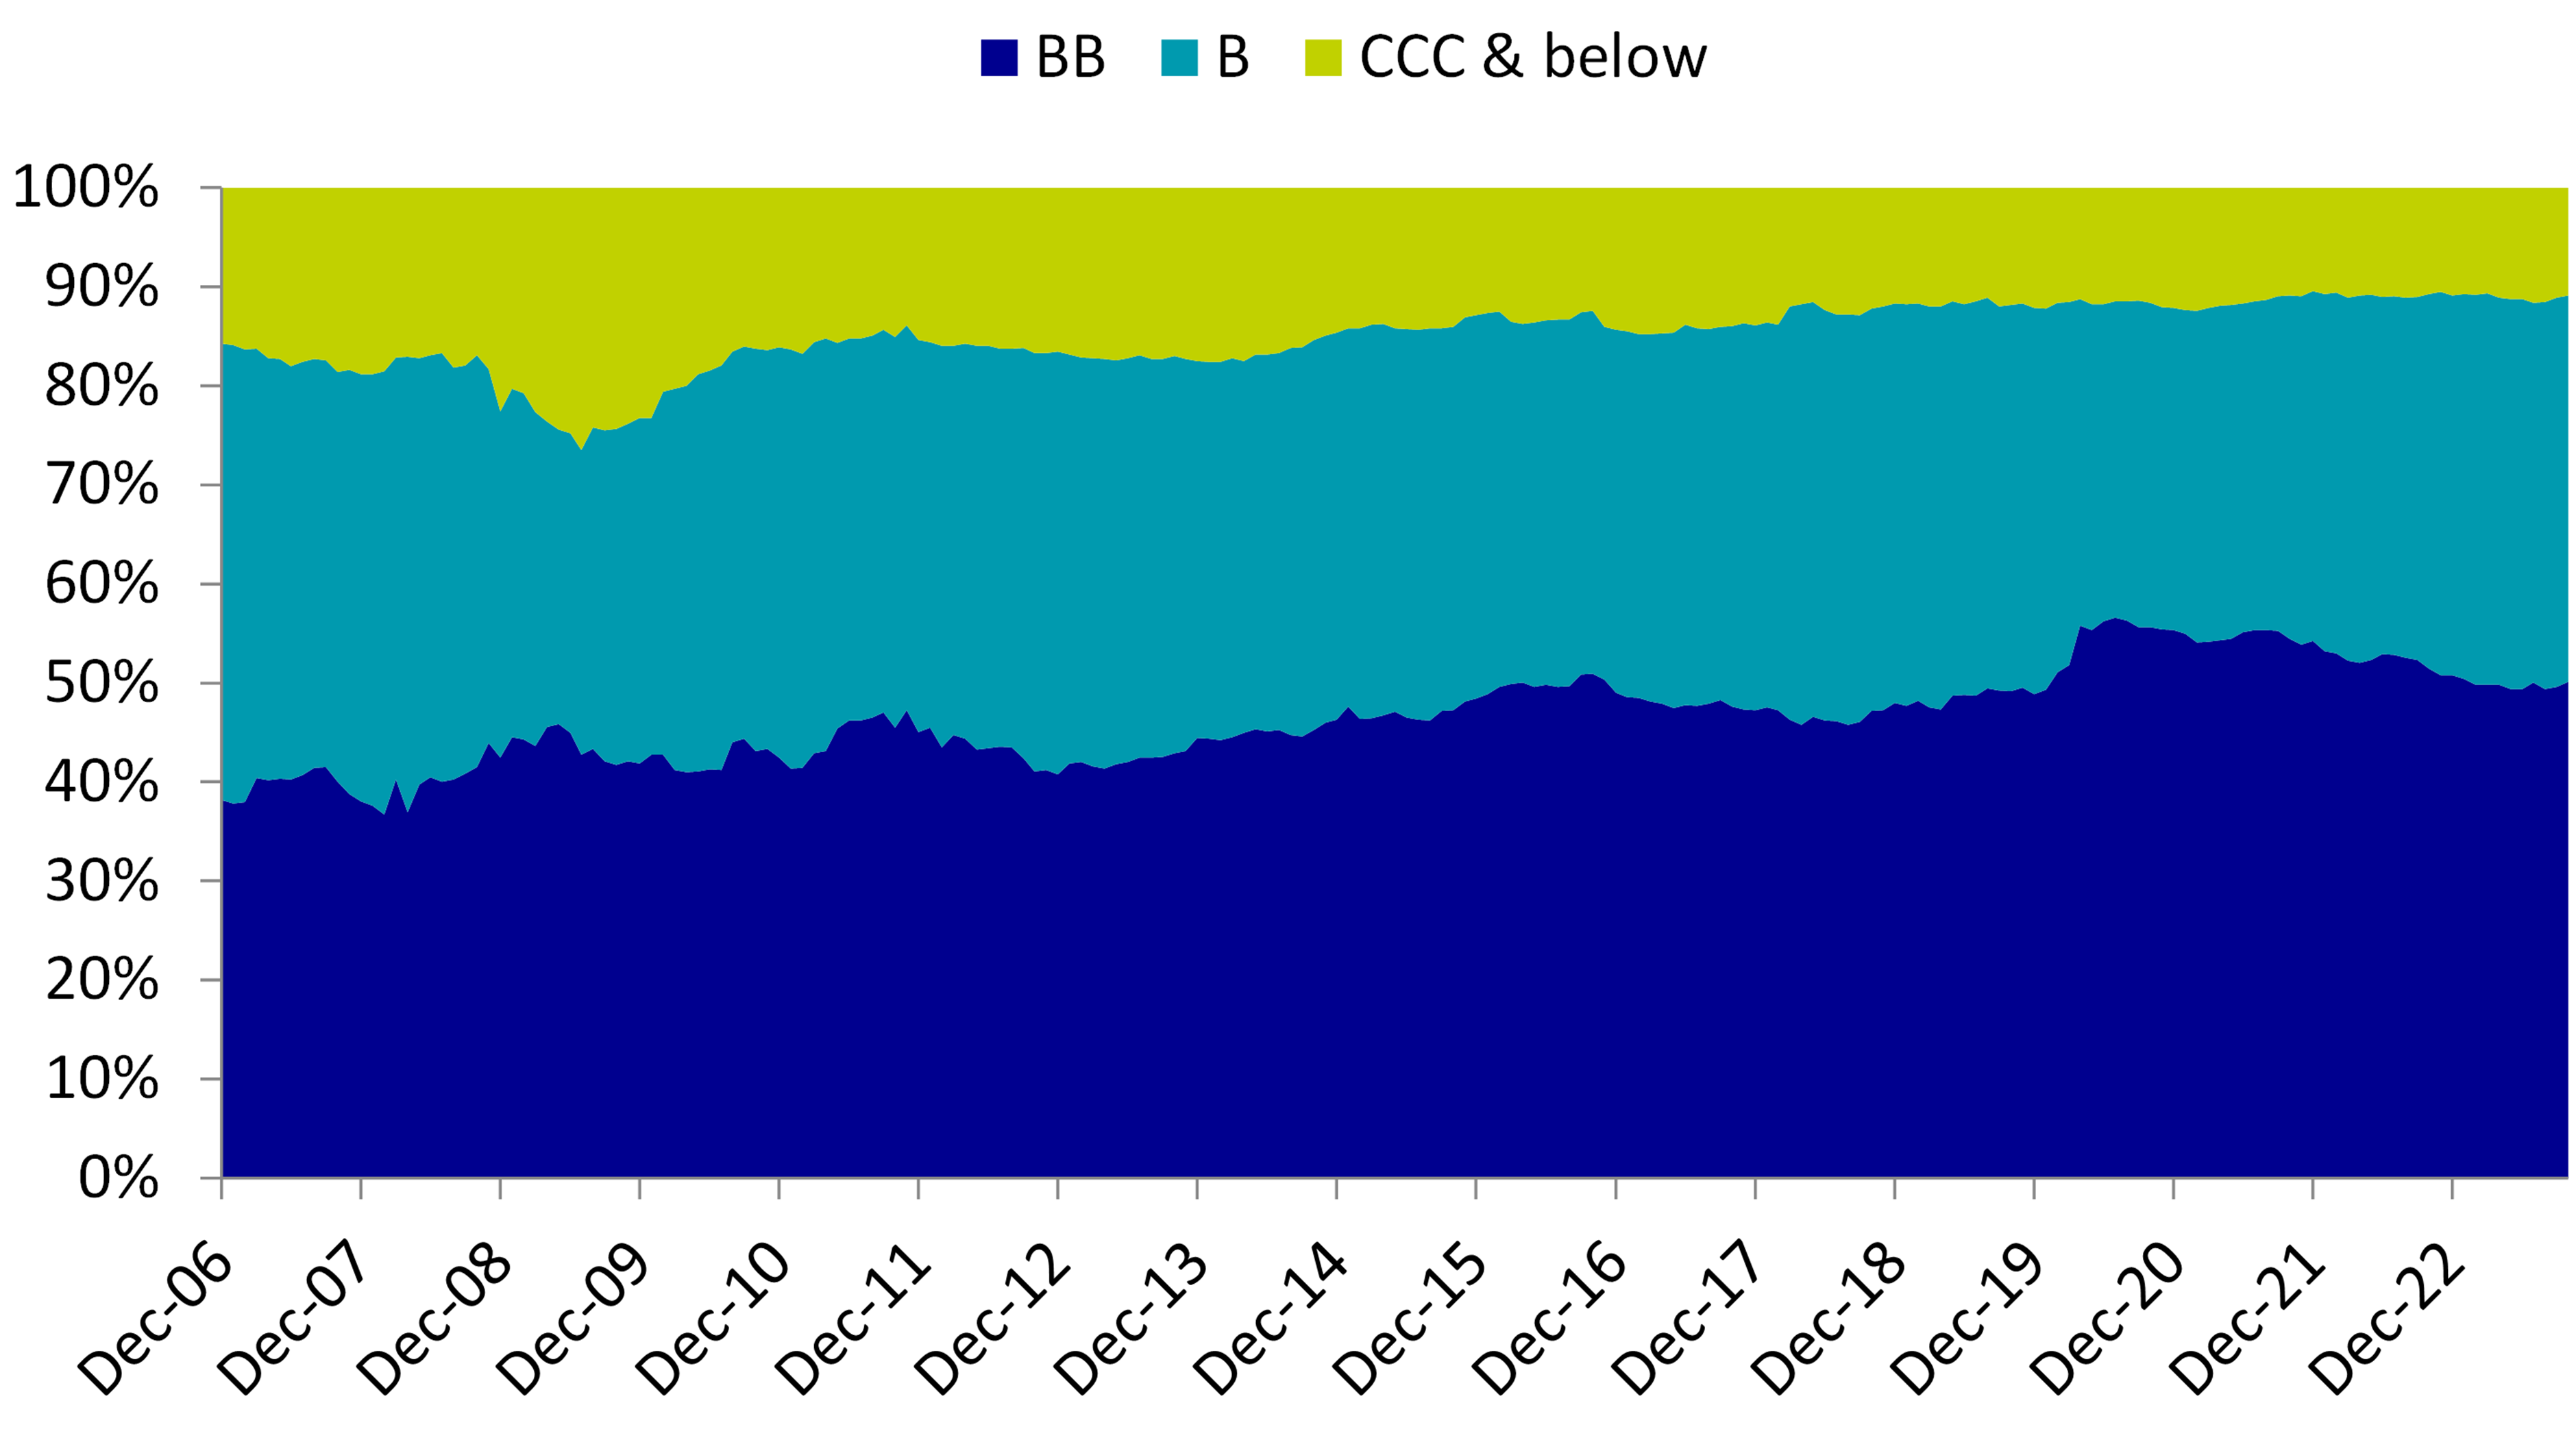
This selective approach to high yield investing does not have to feel like a compromise. Firstly, over the past few years, there have been a wave of upgrades within the US high yield market1 and downgrades from investment grade to BB.2 This has resulted in the US high yield market, which numbers 880 issuers3 in total, moving up in quality: today just 11% of the broad market is rated CCC and below, compared to 49% rated BB and 40% rated B. As the chart below demonstrates, although the lowest rated part of the market has historically always accounted for the smallest component by market value, at more distressed points of the cycle we have seen the amount of CCC and below securities rise as high as 26% in 2009 after the Global Financial Crisis and 15% in 2017 after the wave of energy company downgrades. The historically low percentage of CCC securities in the market today is a sign of strong fundamental strength, but also means that B/BB investors still have access to around 90% of the overall market in market value terms.
Breakdown of the US high yield market by credit rating buckets
Despite representing the smallest rating bucket by market value, the CCC and below component accounts for the largest proportion of default activity within the US high yield market. We believe that the ‘truest’ way of measuring the credit rating spectrum is on an exponential rather than linear scale, with the credit curve acting as an indicator of underlying default risk, measured in spread (basis point) terms. Credit spreads increase exponentially down the curve to compensate for the underlying credit risk, highlighted by the chart below.
This chart, which plots the average spread of different rating buckets across the full US credit spectrum over a 20-year period, shows that the spread differential between BBB and BB rated securities is 154bps, whereas the difference between B and CCC rated securities is higher at 493bps. Therefore, we may consider that, despite BBB and BB securities being differentiated by rating agencies in terms of ‘investment grade’ versus ‘high yield’, they have more in common than BB securities have with CCC securities.
Plotting the US credit spectrum by average spread*
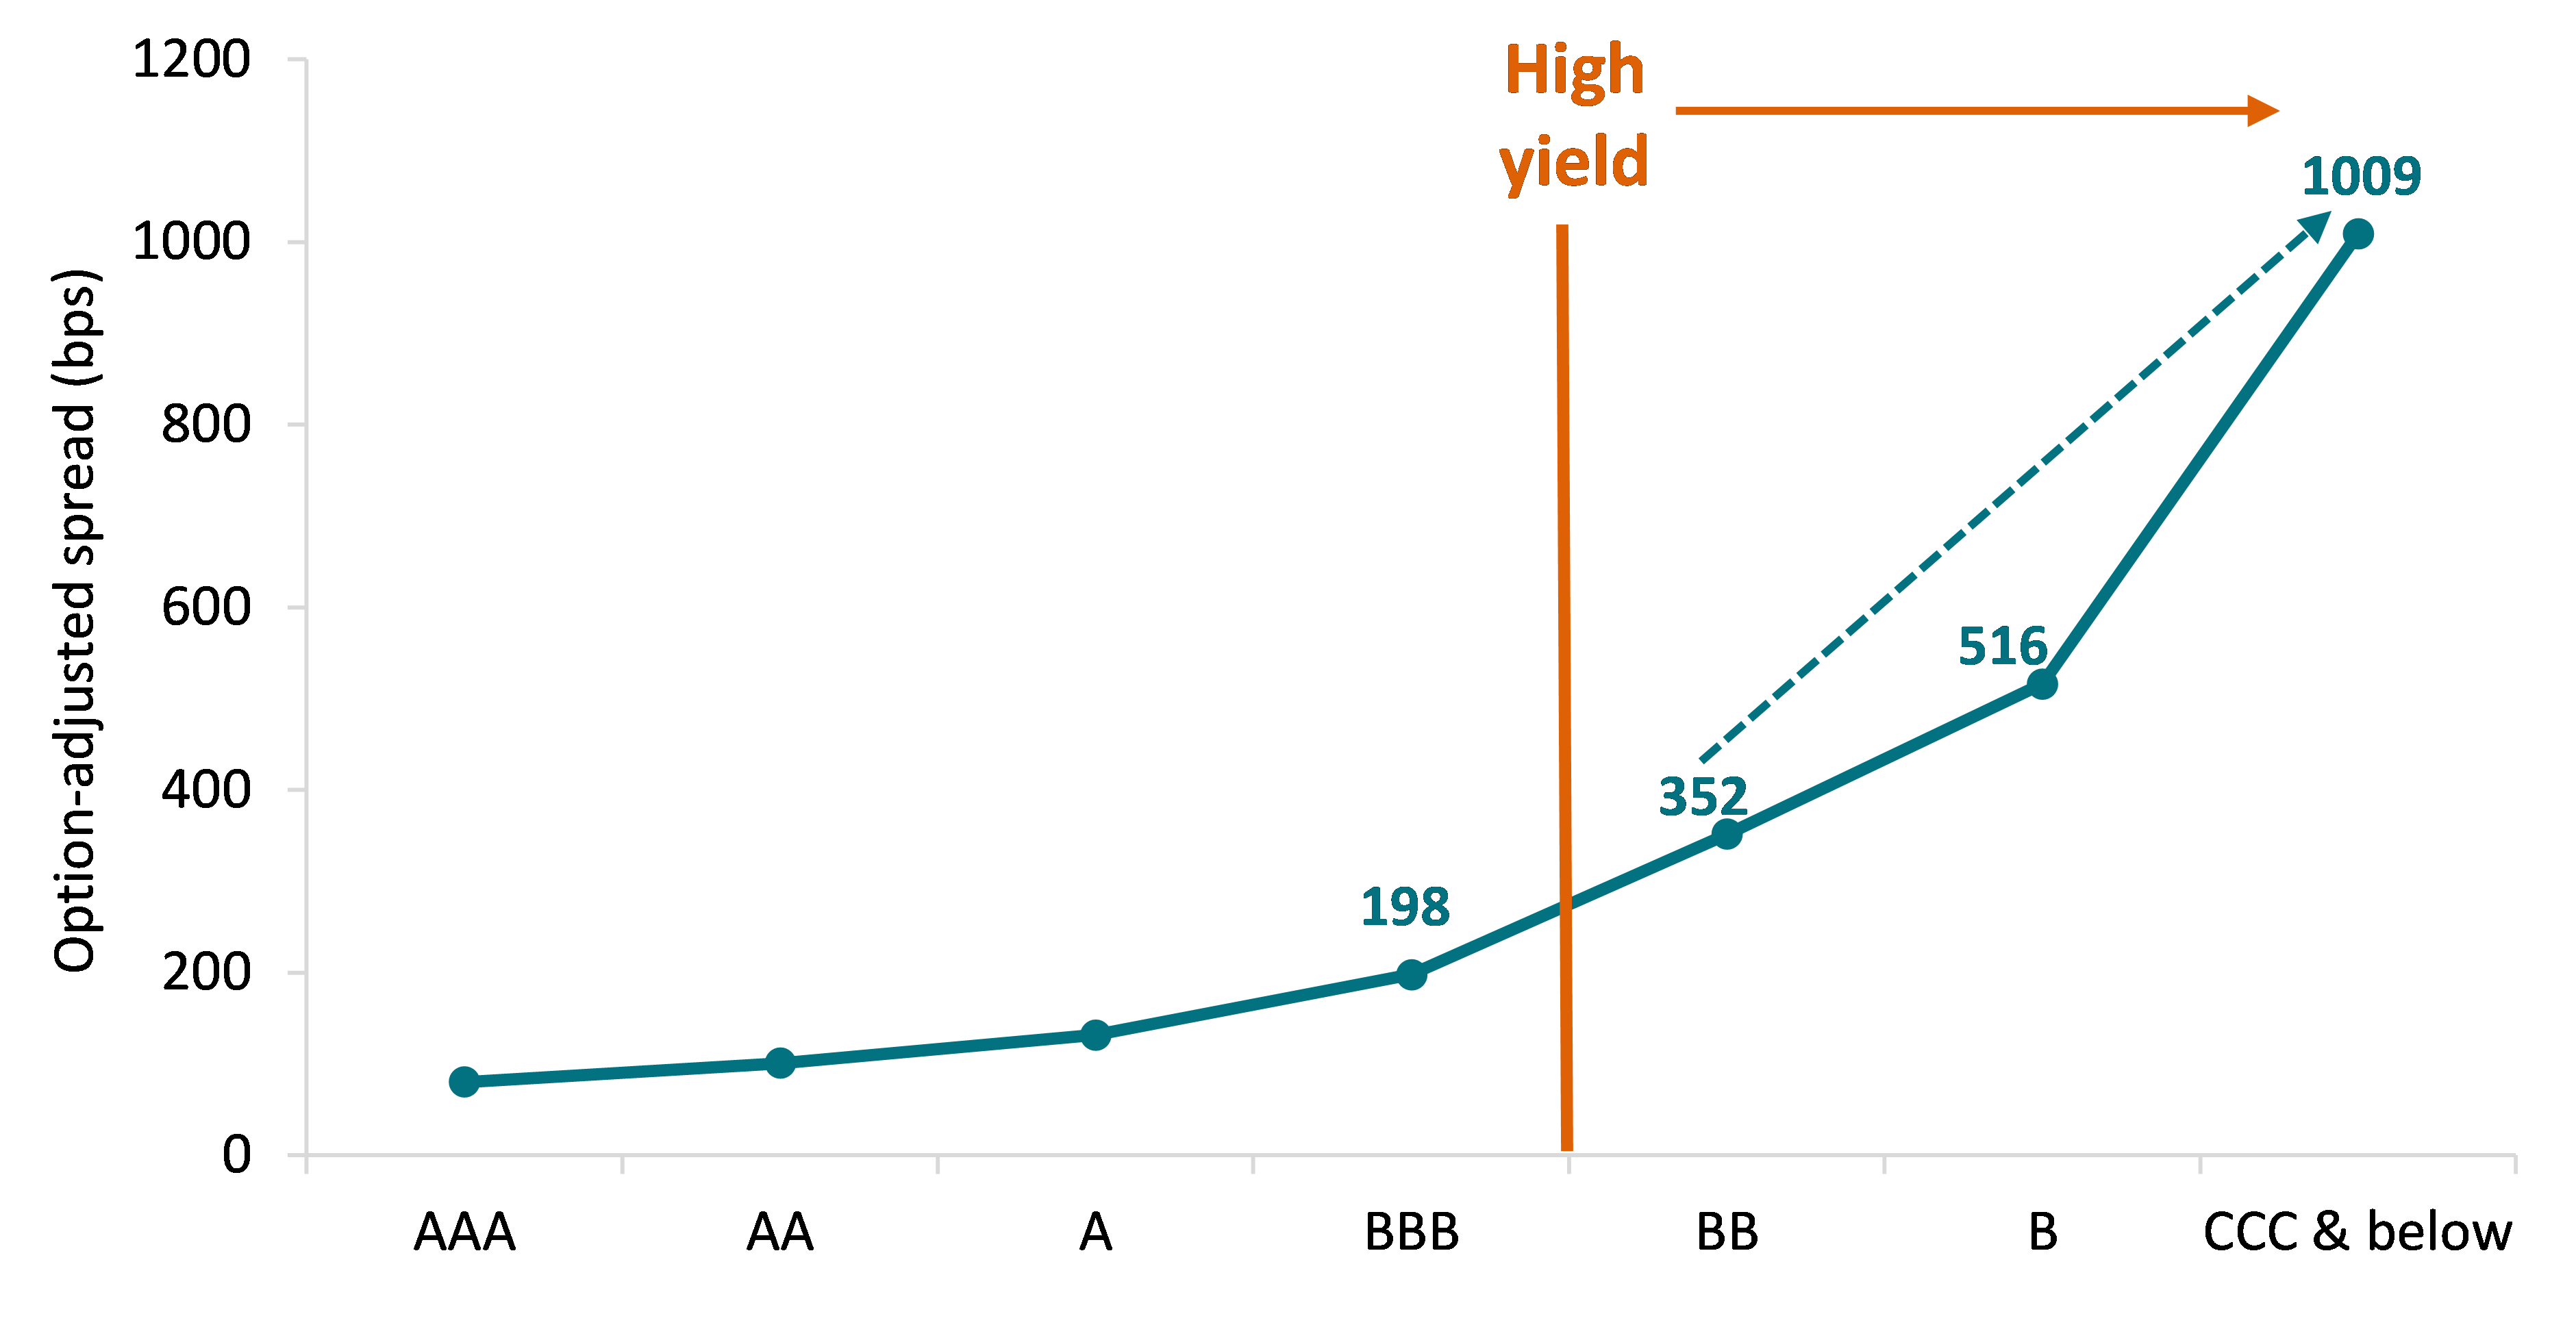
Source: AXA IM, ICE BofA, as of 31 October 2023. * Average spread relates to a 20-year period covering 31 October 2003 to 31 October 2023.
This exponential credit risk is reflected in the fact that the bulk of historical high yield default activity has occurred within the CCC rated bucket. Looking at the 25-year average default rate the largest component of this is CCC/split CCC, tracking at around double the overall high yield default rate of 2.99% for this period:
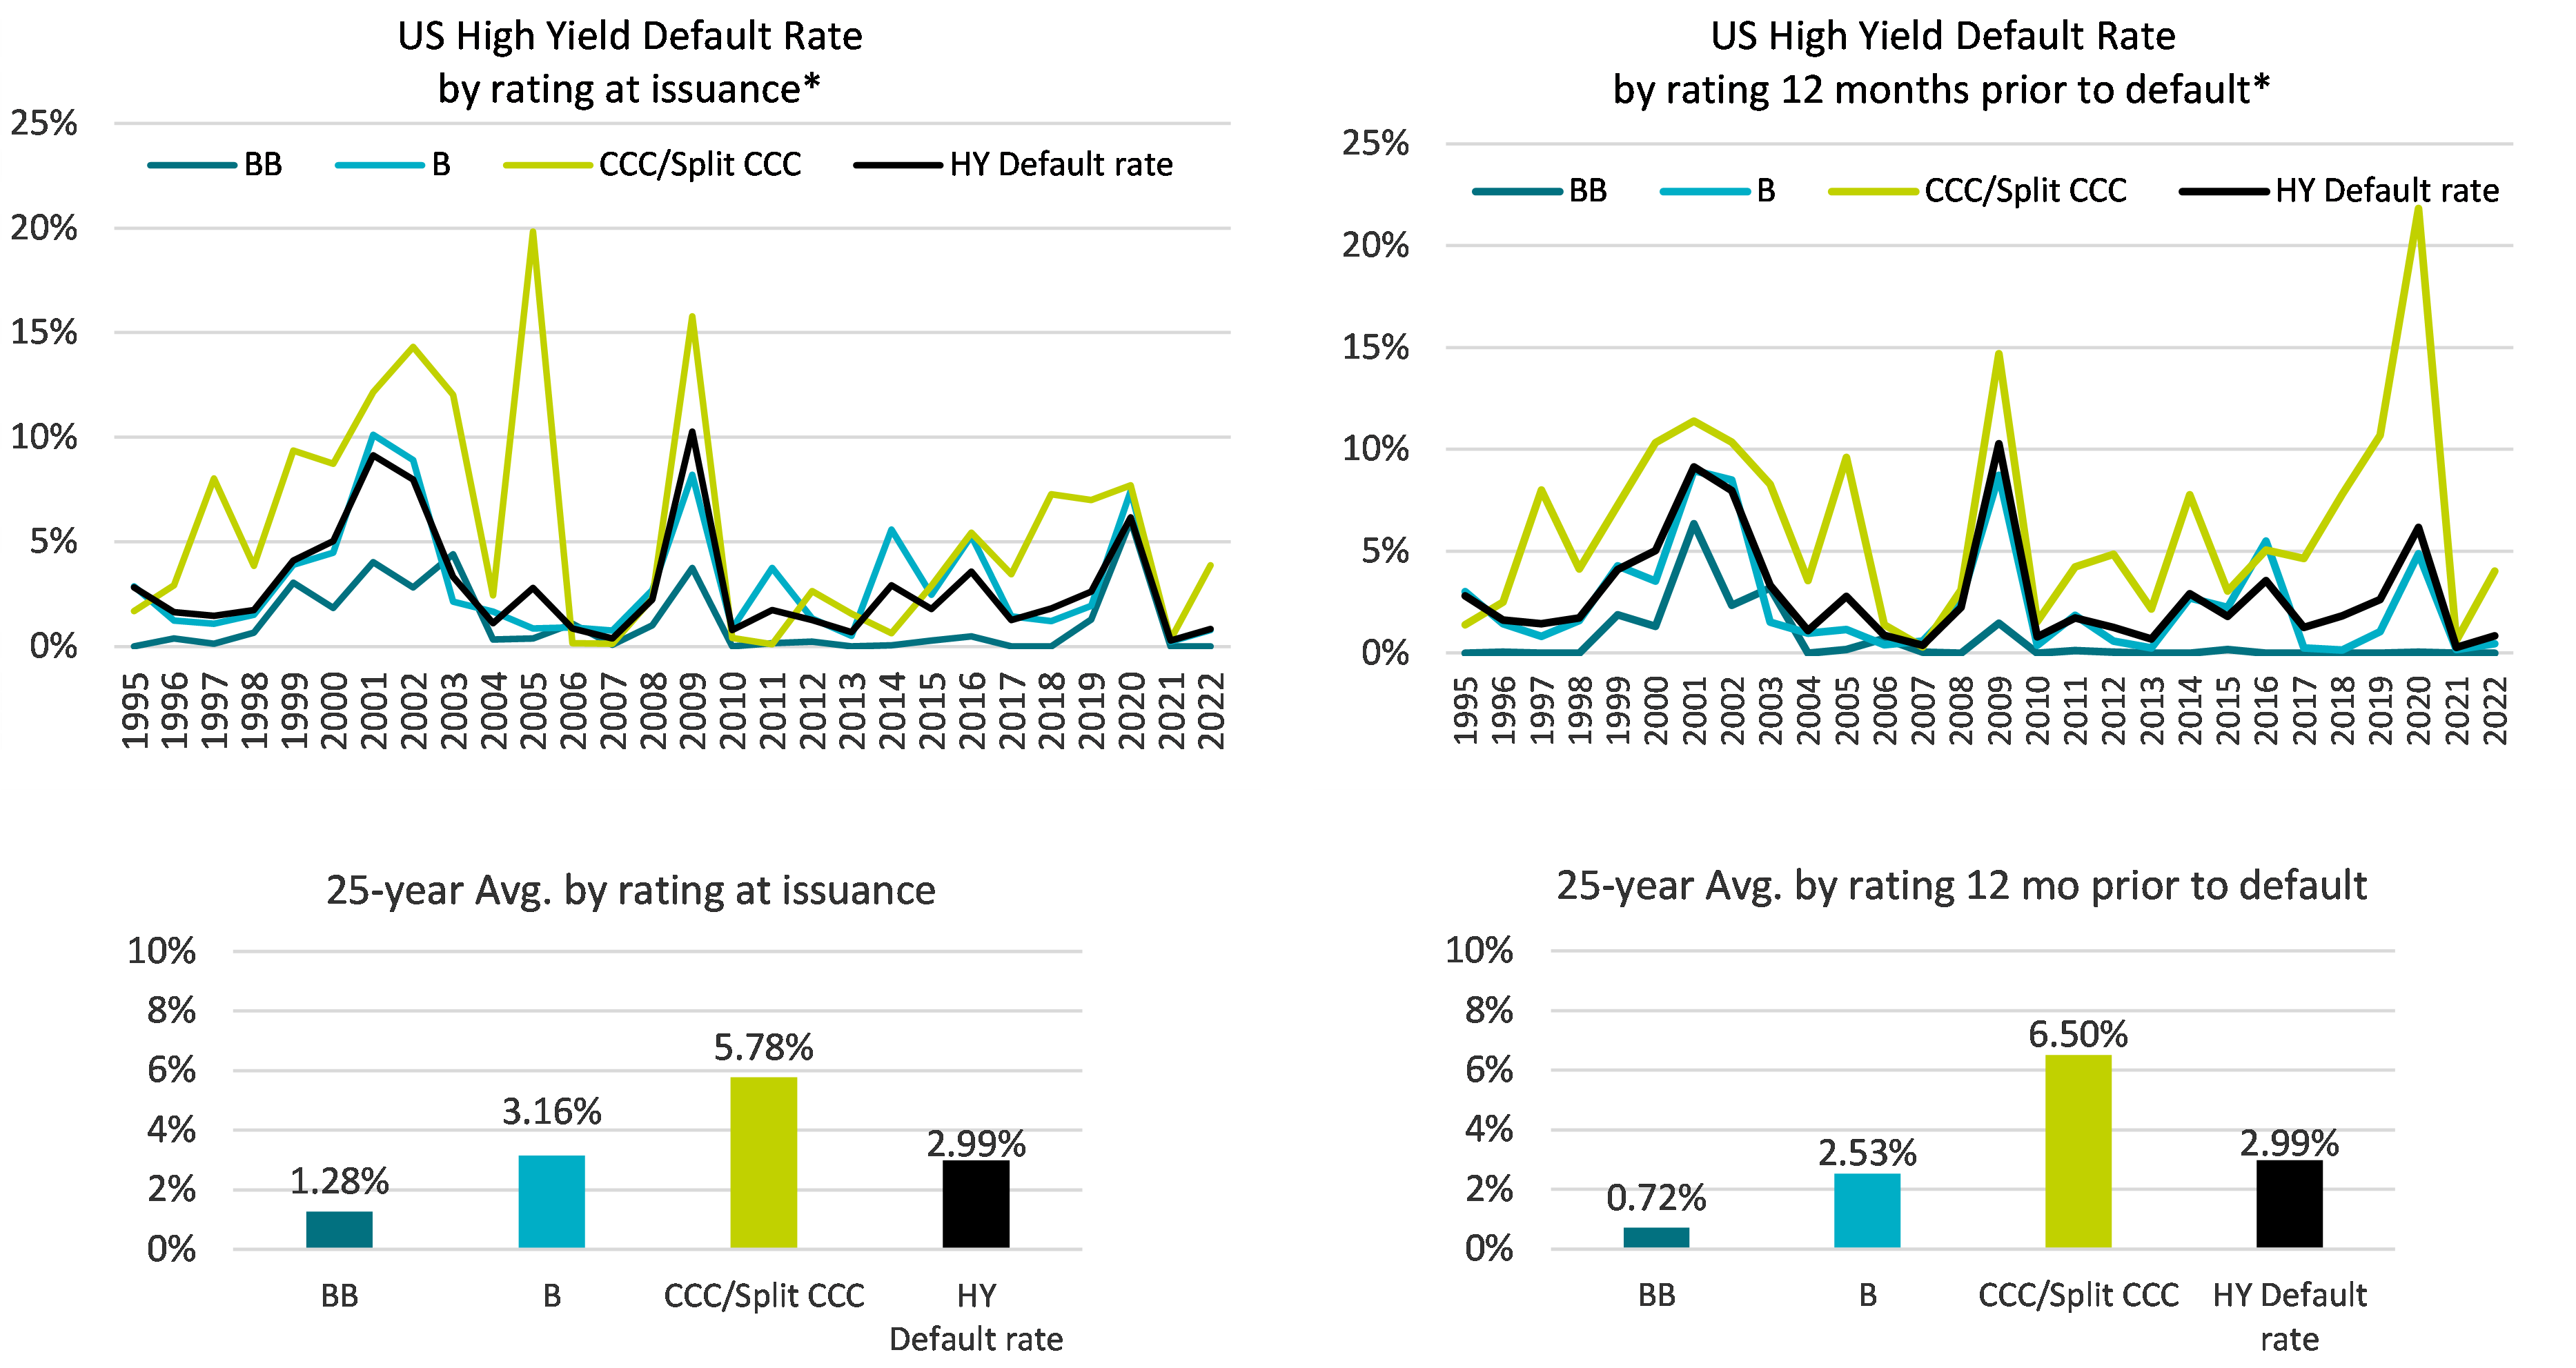
Source: JP Morgan as of 31 December 2022. *Evolution of default rate taking into account full calendar year data, including distressed exchanges. For illustrative purposes only. Investing involves risk and past performance does not guarantee future results. No assurance can be given that the strategy will be successful or achieve its objectives.
That is not to say that we do not like investing in CCC rated securities. To the contrary, we find plenty of opportunities in improving CCC rated credits that may be penalised by rating agencies for having higher leverage and lower asset values, but which we believe have sound fundamentals and hence less business or operational risk. We feel comfortable holding these credits, however believe that robust, prudent credit analysis and active management are required to ensure that we try to avoid losses and defaults.
- QmV0d2VlbiAyMDIwIGFuZCAyMDIy
- SW4gMjAyMA==
- U291cmNlOiBBWEEgSU0sIEJsb29tYmVyZyBhcyBvZiAzMCBOb3ZlbWJlciAyMDIz
Ways to think about positioning a B/BB strategy within a diversified portfolio
The chart below shows the 20-year annualised returns of the B/BB US high yield universe compared to other US fixed income asset classes. Historically, this universe has captured a large percentage (95%) of the overall US high yield market return, despite carrying significantly lower default risk. It has also outperformed the broad US investment grade market:
Source: AXA IM, ICE BofA, eVestment, as of October 31, 2023.
When considering the volatility of these asset classes, the B/BB US high yield universe is even more compelling on a risk-adjusted return basis, with a higher Sharpe ratio than both the broad US high yield and investment grade markets:
Source: AXA IM, ICE BofA, eVestment, as of October 31, 2023.
Investment grade potential
The charts above suggest that a B/BB strategy can be used as a compliment to an investment grade allocation. While the volatility is higher for the B/BB Index compared to the US Corporate Index, it has provided investors with around 220bps of annualised outperformance for this additional risk, resulting in the improved Sharpe ratio.
By focusing on the B/BB component of the high yield market, investors may also place greater emphasis on larger high yield issuers which offer quasi-investment grade credit quality but with higher yields, as well as potential rising stars to investment grade. Ford is an example of this – a company that was the largest issuer in the US high yield market (~3% or $40 billion of the index market value) which has recently been upgraded by S&P to BBB-4 . Rising stars such as Ford are expected to total c.$45 billion over the next 12 months5 , offering potential tailwinds for the BB and investment grade markets.
There are also current market trends that we believe could provide a further benefit to higher quality high yield strategies. We are entering a period where company management teams are highly incentivised to de-lever their balance sheets after many years of cheap debt that companies took advantage of. Today, debt is expensive, even relatively speaking for BB or investment grade rated companies. Companies are using asset sales and equity raises to lower the amount of debt in their capital structure. This results in them keeping interest rate expense closer to what they had during a low-rate environment and attracts upgrades from credit rating agencies as it improves their credit quality. In the past, we would not see a lot of opportunities for credit improvement in double-B or single-B rated issues, however that has changed in today’s environment.
- U291cmNlOiBBWEEgSU0sIEJsb29tYmVyZyBhcyBvZiBOb3ZlbWJlciAyMDIz
- U291cmNlOiBSZXV0ZXJzLmNvbSBhcyBvZiAzcmQgTm92ZW1iZXIgMjAyMyZuYnNwO0ZvcmQgY3JlZGl0IHJhdGluZyB1cGdyYWRlIHRvIGJvb3N0IGRlbWFuZCBmb3IgVVMgY29ycG9yYXRlIGJvbmRzIC1hbmFseXN0cyB8IFJldXRlcnM=
Why a B/BB US high yield strategy is attractive today
A B/BB strategy may reduce an investors’ sensitivity to overall default risk in the high yield market if a ‘higher for longer’ rate environment leads to a significantly weaker corporate fundamentals than we are expecting. We believe strategies like B/BB with longer duration are also well positioned right now to benefit from a potential peak in Fed Funds rate and the potential for rate cuts in 2024. As the table below shows, this should not come at the expense of much yield give-up, with the B/BB component capturing over 90% of the overall market’s yield-to-worst.
Source: ICE BofA as of 14 November 2023. Market data provided for the following indices: ICE BofA BB-B US High Yield Constrained Index (HUC4); ICE BofA US High Yield Index (H0A0); ICE BofA US Corporate Index (C0A0).
While some investors may prefer to have access to opportunities across the full spectrum of the US high yield market, a B/BB strategy may be a suitable solution for those who are unable, or would rather avoid, high yield bonds rated CCC and below. A B/BB US high yield strategy has the potential to provide an attractive risk/return profile in relation to the broad US high yield market, as well as offering investors an attractive pick-up from investment grade without adding too much additional credit risk.
Related articles
View all articles

Emerging Market Debt: hope springs eternal
- by
- 12 April 2024 (5 min read)

Opportunities for High Yield Investors
- by
- 10 April 2024 (3 min read)

US High Yield Comments
- by
- 10 April 2024 (3 min read)
Disclaimer
The information on this website is intended for investors domiciled in Switzerland.
AXA Investment Managers Switzerland Ltd (AXA IM) is not liable for unauthorised use of the website.
This website is for advertising and informational purpose only. The published information and expression of opinions are provided for personal use only. The information, data, figures, opinions, statements, analyses, forecasts, simulations, concepts and other data provided by AXA IM in this document are based on our knowledge and experience at the time of preparation and are subject to change without notice.
AXA IM excludes any warranty (explicit or implicit) for the accuracy, completeness and up-to-dateness of the published information and expressions of opinion. In particular, AXA IM is not obliged to remove information that is no longer up to date or to expressly mark it a such. To the extent that the data contained in this document originates from third parties, AXA IM is not responsible for the accuracy, completeness, up-to-dateness and appropriateness of such data, even if only such data is used that is deemed to be reliable.
The information on the website of AXA IM does not constitute a decision aid for economic, legal, tax or other advisory questions, nor may investment or other decisions be made solely on the basis of this information. Before any investment decision is made, detailed advice should be obtained that is geared to the client's situation.
Past performance or returns are neither a guarantee nor an indicator of the future performance or investment returns. The value and return on an investment is not guaranteed. It can rise and fall and investors may even incur a total loss.
AXA Investment Managers Switzerland Ltd.